Data &
Technology
Research
Reports
Report Solutions
Reports Library
Actionable
Strategies
Free
Resources
Simple Backtest Calculator
Simple Seasonality Calculator
The Kelly Criterion Calculator
Sentiment Geo Map
Public Research Reports
Free Webinar
Pricing
Company
About
Meet Our Team
In the News
Testimonials
Client Success Stories
Contact
Log inLoginSign up
< BACK TO ALL REPORTS

An extreme in extremes

Jason Goepfert
2020-02-28
This week has seen one of the fastest-ever declines from an all-time high. Breadth metrics for S&P and NDX stocks are hitting historic extremes.

Quick pullback

The swiftness of the decline this week is unusual in many respects, perhaps none more so than the fact that it originated from all-time highs. Very often when we see severe declines over a compressed time period, it’s after stocks have already been declining for a while.

This has been one of the fastest-ever declines into correction territory for the major indices, especially the Dow Industrials, even using price history back to the year 1900.

Even just looking at the 5-day drop of more than -5%, this qualifies as one of the most severe, most compressed declines from an all-time high since 1928 for the S&P 500.

S&P pullback from all time high

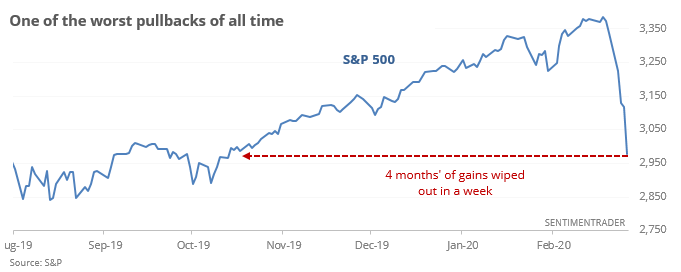
It’s also worth mentioning that this is the fastest that the S&P 500 has ever cycled from an all-time high to wiping out at least 4 months’ worth of gains. It’s happened only twice before in less than 10 days.

S&P wipes out 4 months of gains

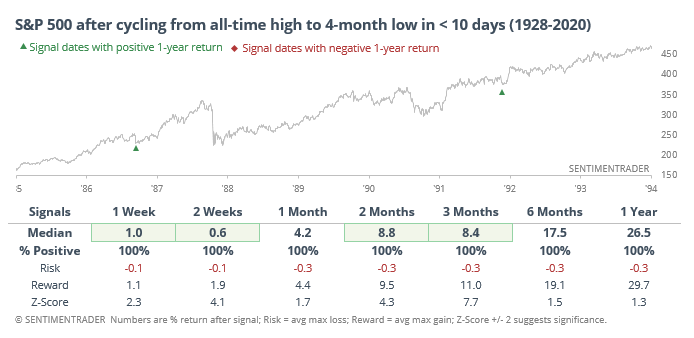
Granted, we can't take much from a sample size of two. But when we look at the decline this week from a variety of perspectives, the implications point almost exclusively in the same direction.


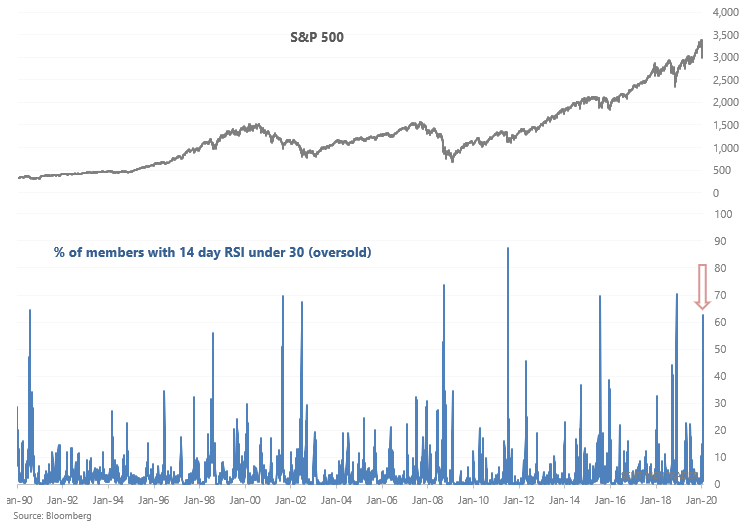
Breadth is reaching historic extremes

The stock market's continued decline has pushed indicators that were in somewhat-extreme-territory into very-extreme-territory. For example, more than 62% of the S&P 500's members are oversold (RSI < 30). This is a level that has only been matched a few other times in history:

S&P 500 oversold members

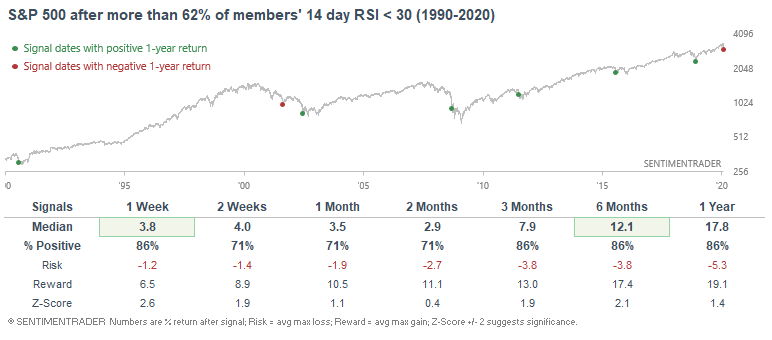
So what does this all mean? As one would assume, this is short term bullish for U.S. equities.

While it doesn't mean that the exact bottom has arrived (no one can consistently and accurately predict exact tops and bottoms), it does mean that risk:reward is starting to favor bulls. Here's what the S&P did next when many of its constituents were oversold:

S&P members oversold

This is an abridged version of our recent reports and notes. For immediate access with no obligation, sign up for a 30-day free trial now.

We also looked at:

  • Smart Money and Dumb Money Confidence has flipped for the 1st time in 90 days
  • So has the percentage of optimistic vs pessimistic indicators
  • What happens when the S&P 500 falls 5% from an all-time high in only a week
  • The S&P, Dow Industrials, and Russell 2000 all fell below their 200-day averages, but there was a holdout
  • S&P 500 stocks are also below their volatility bands and moving averages
  • Stocks in the Nasdaq, too
  • ETF volume is spiking relative to underlying stocks
  • Volatility is jumping
  • What happens after stocks suffer a 10% weekly drawdown
DATA &
TECHnologies
IndicatorEdge
‍
BackTestEdge
‍
Other Tools
‍
DataEdge API
RESEARCH
reports
Research Solution
‍
Reports Library
‍
actionable
Strategies
Trading Strategies
‍
Smart Stock Scanner
‍
FREE
RESOUrCES
Simple Backtest
Calculator
Simple Seasonality
Calculator
The Kelly Criterion
Calculator
Sentiment Geo Map
‍
Public Research Reports
‍
Free Webinar
COMPANY
‍
About
‍
Meet our Team
‍
In the News
‍
Testimonials
‍
Client Success Stories
Pricing
Bundle pricing
‍
Announcements
‍
FAQ
© 2024 Sundial Capital Research Inc. All rights reserved.
Setsail Marketing
TermsPrivacyAffiliate Program
Risk Disclosure: Futures and forex trading contains substantial risk and is not for every investor. An investor could potentially lose all or more than the initial investment. Risk capital is money that can be lost without jeopardizing ones’ financial security or life style. Only risk capital should be used for trading and only those with sufficient risk capital should consider trading. Past performance is not necessarily indicative of future results.

Hypothetical Performance Disclosure: Hypothetical performance results have many inherent limitations, some of which are described below. No representation is being made that any account will or is likely to achieve profits or losses similar to those shown; in fact, there are frequently sharp differences between hypothetical performance results and the actual results subsequently achieved by any particular trading program. One of the limitations of hypothetical performance results is that they are generally prepared with the benefit of hindsight. In addition, hypothetical trading does not involve financial risk, and no hypothetical trading record can completely account for the impact of financial risk of actual trading. for example, the ability to withstand losses or to adhere to a particular trading program in spite of trading losses are material points which can also adversely affect actual trading results. There are numerous other factors related to the markets in general or to the implementation of any specific trading program which cannot be fully accounted for in the preparation of hypothetical performance results and all which can adversely affect trading results.

Testimonial Disclosure: Testimonials appearing on this website may not be representative of other clients or customers and is not a guarantee of future performance or success.