
An Extreme - And Protracted - Stretch Of Optimism

Extreme, and protracted
On December 26, a bout of enthusiasm pushed 56% of our core indicators into an optimistic extreme, which was the most in 15 years. We just surpassed that, with 57% of them hitting an extreme on Thursday.
For the past month, there has been an extreme number of indicators showing optimism and few showing pessimism (mostly fund flows). That has pushed the 20-day average spread between the extremes to one of the widest levels since we began tracking them 20 years ago.
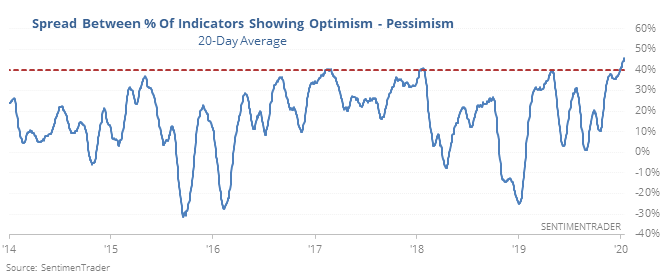
There have been 5 other times when the spread got almost this extreme. The most consistent thing about the S&P 500's forward returns was a lack of sustained upside once it reached this point. While several showed gains over the next couple of weeks, all of them showed losses between one and six months later.
This is also the case - but over an even longer time frame - for the spread between Smart Money and Dumb Money Confidence.
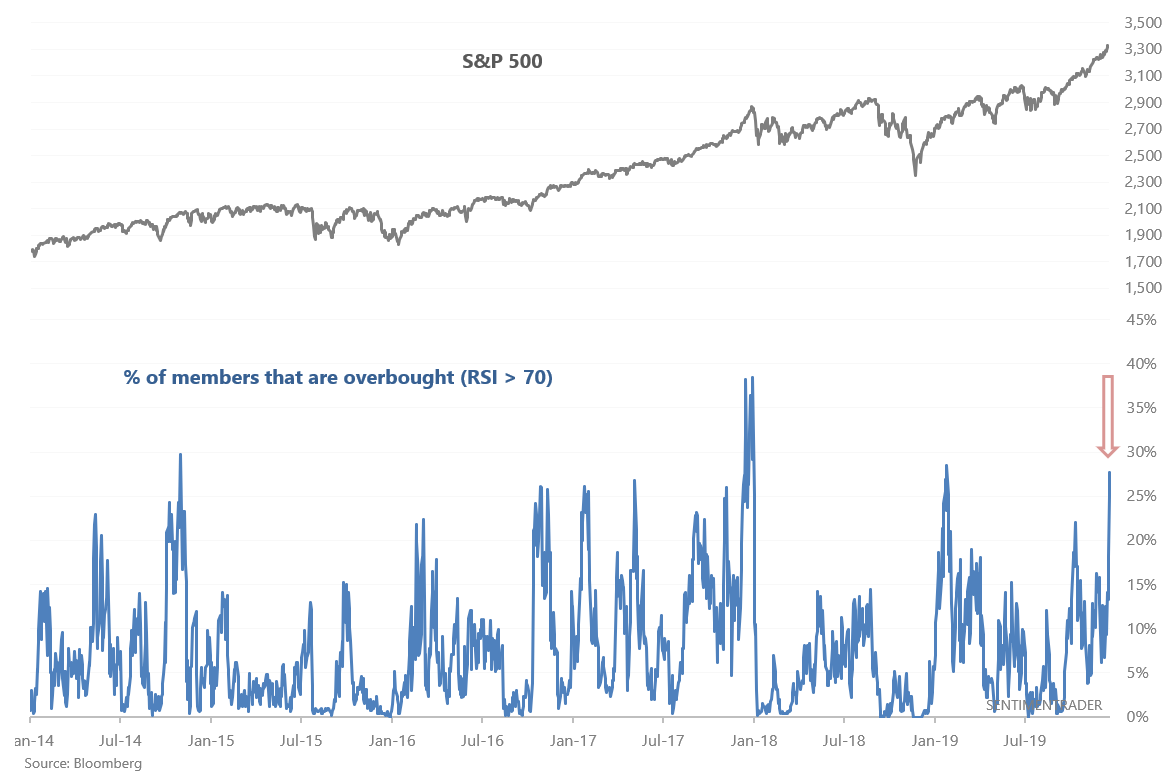
Momentum: strong, or too much?
Most sentiment-related indicators are showing so much optimism that it typically leads to flat or lower prices in the weeks to months ahead. Among all types of analyses we do, really the only ones showing positive forward returns deal with momentum.
It's hard to draw the fine line between "strong momentum will lead to more short term gains" vs. "the market's short term momentum is too strong, and it will pullback soon". But there are signs that the later is starting to become true. More than 27% of the S&P 500's members are overbought (14 day RSI > 70), one of the highest readings over the past 5 years.
When this many members of the S&P 500 became overbought, the S&P had mediocre returns over the medium-term.
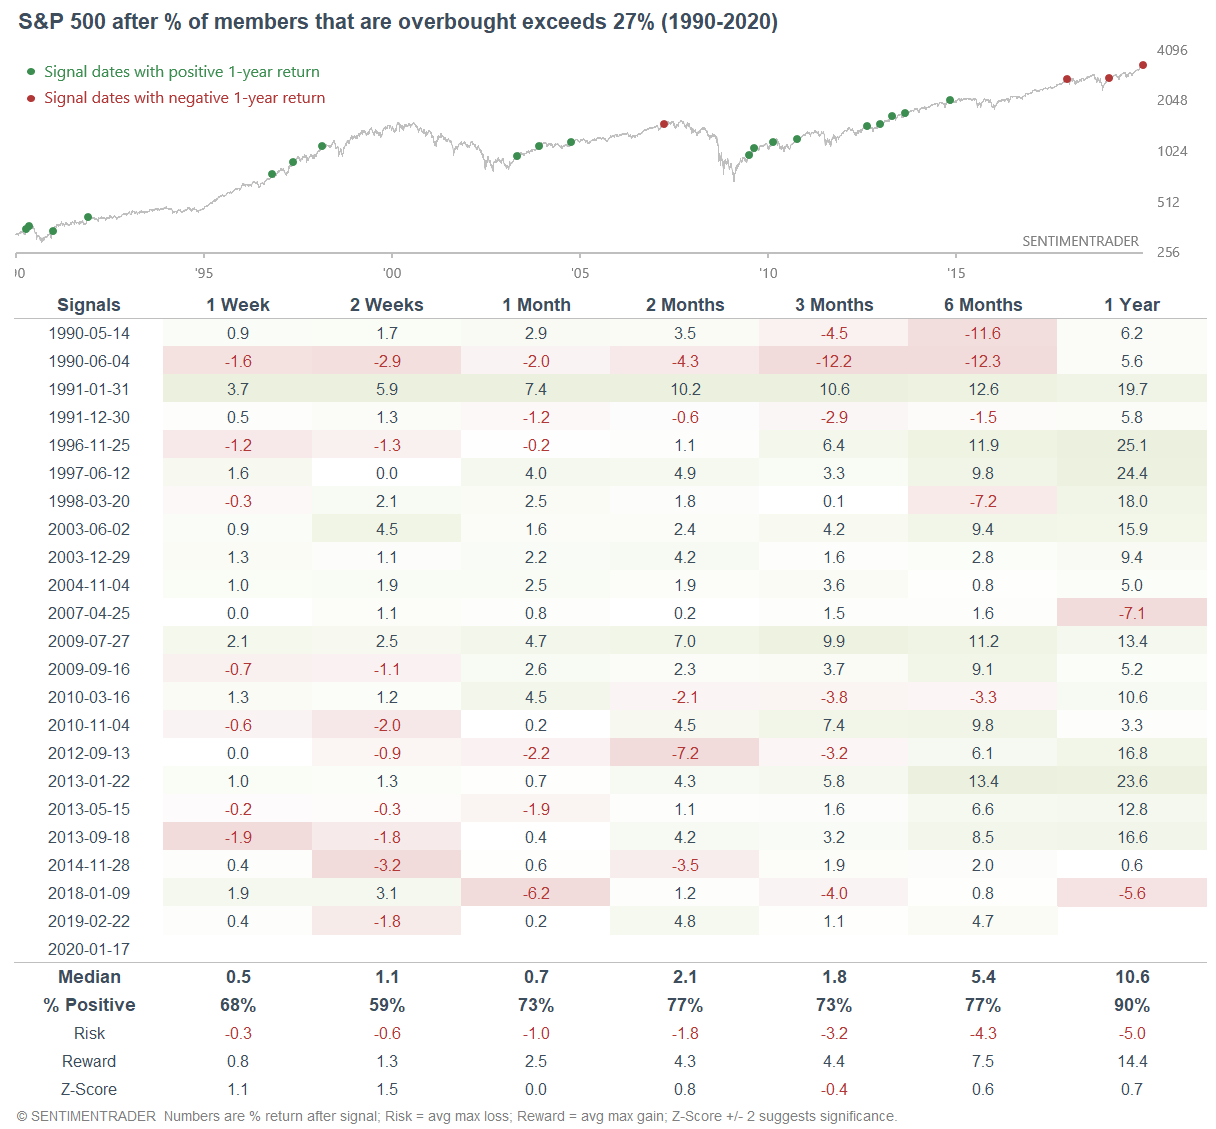
It was especially negative over the 2-4 weeks over the past decade.
This is an abridged version of our recent reports and notes. For immediate access with no obligation, sign up for a 30-day free trial now.
We also looked at:
- The S&P 500 is above its upper Bollinger Band on daily, weekly, and monthly time frames
- What happens when housing starts jump over the past year
- The Nasdaq McClellan Summation Index has been sustained in positive territory
- There was yet another jump in 52-week highs on the NYSE
- Small-caps are getting very close to breaking out