
An exceptionally strong time for developed markets

Key points:
- As of Friday, every major market was in a medium-term uptrend within long-term bull markets
- It had been years since global momentum was this impressive and is unusually strong
- Stock markets have performed exceptionally well after these conditions, especially in the U.S. and other developed markets
All major markets are in medium- and long-term uptrends
Traders returned from vacation with a crabby disposition. Anyone who's been around for a while will know this is not unusual. There is a definite negative bias following exchange holidays. People are funny.
Just before they hit the sell buttons, conditions looked pretty good, not just in the U.S. but also pretty much everywhere. Among nearly two dozen (mostly) developed markets, every single one was in a medium-term uptrend within long-term uptrends. The last time that happened was nearly four years ago.
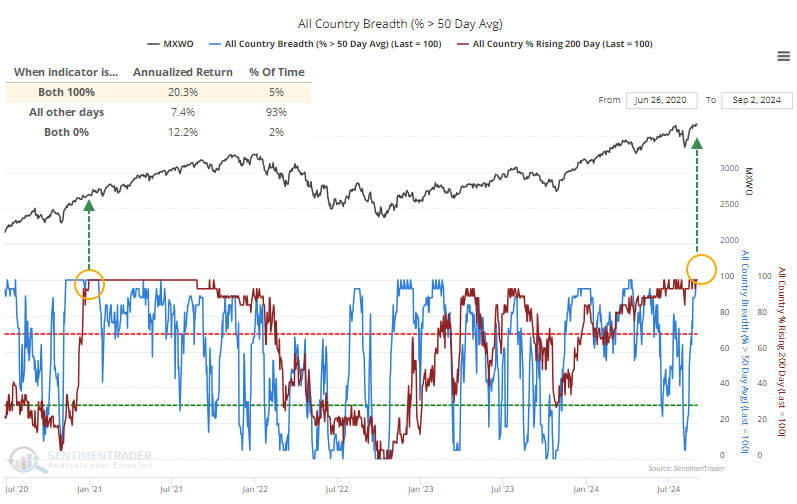
The chart above shows that when both indicators are at 100%, developed markets returned an annualized +20.3% (high positive momentum) and +12.2% when both were at 0% (deeply oversold), versus only +7.4% during the mushy middle days.
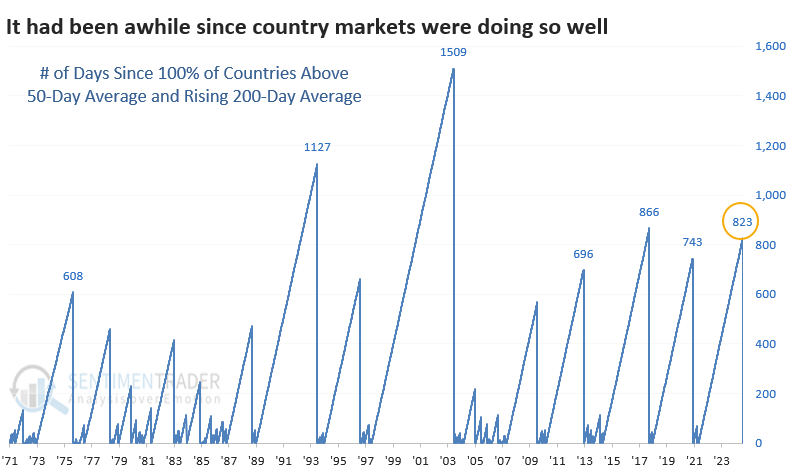
In over 50 years, we've seen only a handful of times when every market was above its 50-day moving average and had a rising 200-day moving average after years without that condition. The last trading day of August ended the 4th-longest streak without this many strong uptrends.
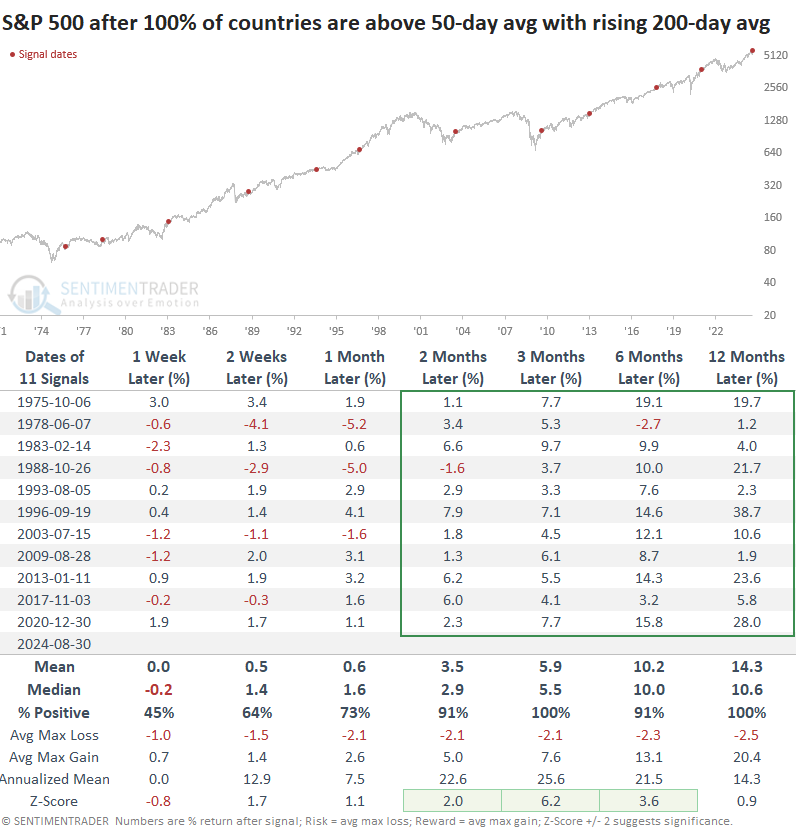
Few losses after global momentum like this
While these trends are specifically not focused on the United States, it's worth looking at returns in the S&P 500 after these conditions were met. It is the most benchmarked index in the world, after all. And its returns following these signals were exquisite.
From two to twelve months later, the S&P showed only a single loss across any time frame, and those losses were tiny and quickly erased. Its risk/reward ratio up to a year later was exceptional.
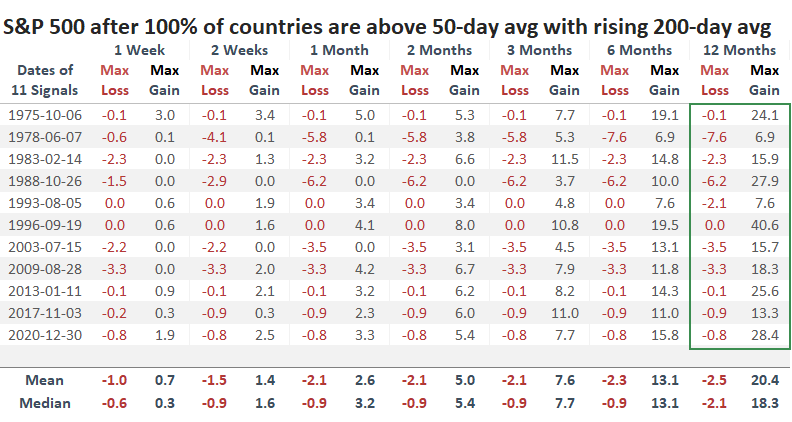
Focusing on that risk and reward, the table below shows that the maximum drawdown in the S&P within the next year was only -7.6%. On average, the S&P pulled back only -2.1%.
If we broaden our horizons and look at the MSCI Developed Markets Index, which includes the U.S., we can see that returns were still extremely strong. There were no losses of note across any time frame for any signal.
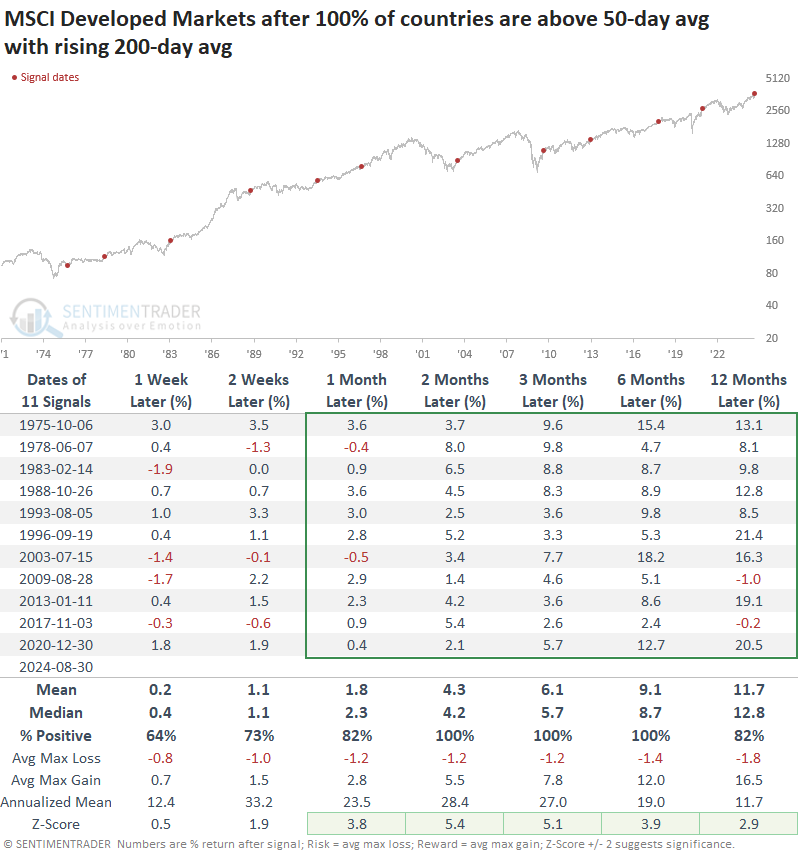
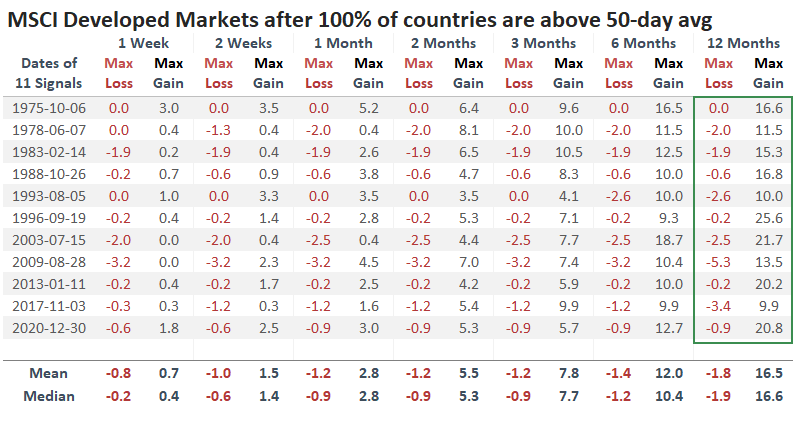
The risk/reward for this index was superior to that for the S&P 500, which is remarkable. Up to a year later, the maximum drawdown across all signals was only -5.3%, and the median was only -1.9%.
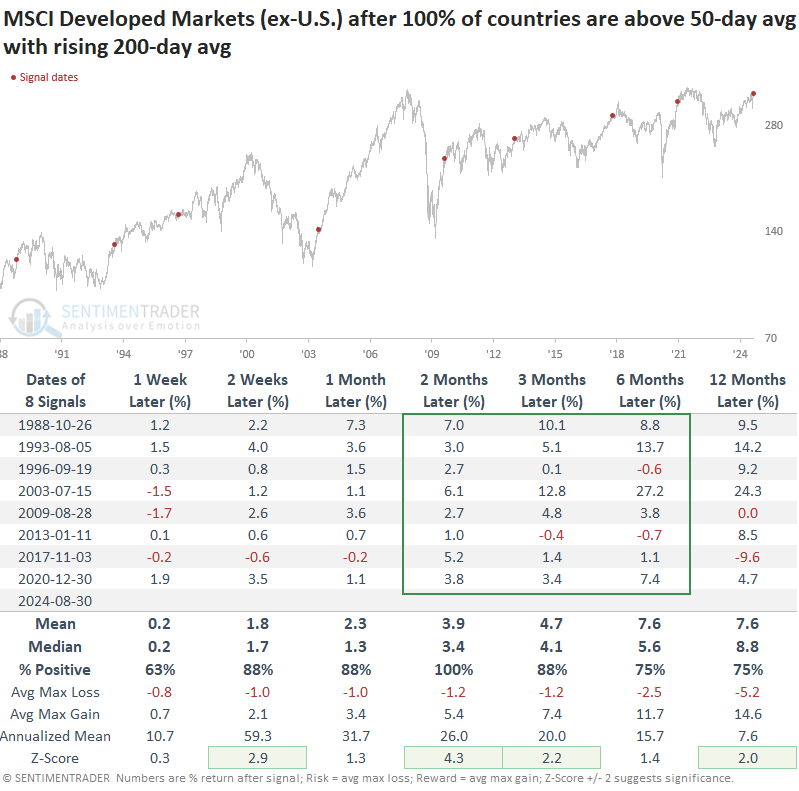
The sample size contracts if we exclude the U.S. from the indexes since the ex-U.S. index only dates back to 1988, eliminating three signals. Still, returns were excellent, especially during the medium term. In 2017, it did lead to a relatively large loss over the next twelve months.
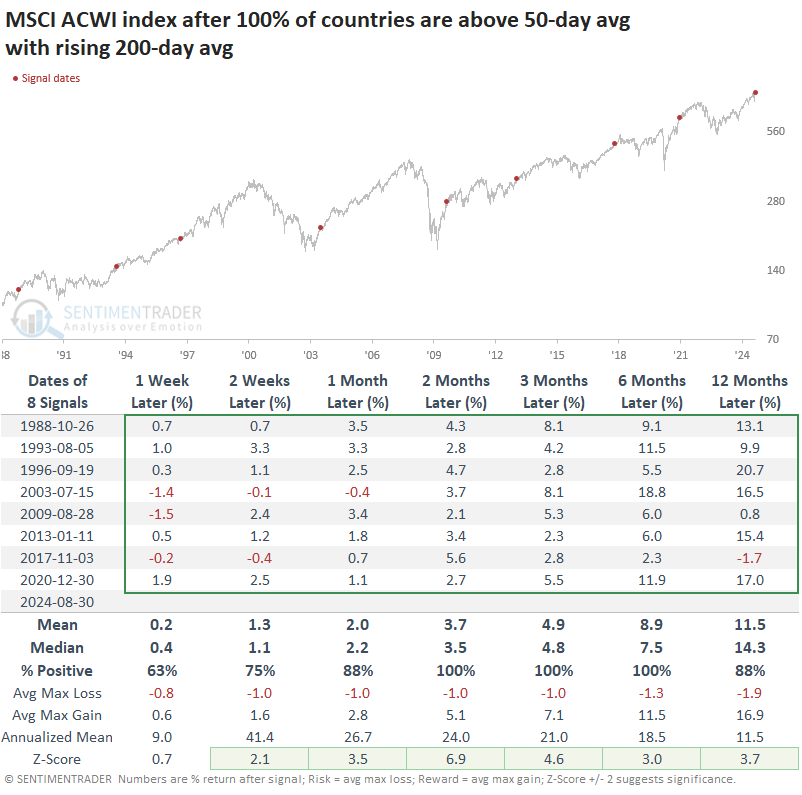
Returns were still excellent if we look at all markets, including both developed and emerging countries. Across all time frames for all signals, there were no losses larger than -1.7%
What the research tells us...
There were legitimate concerns about the narrowness of the rally early in 2024. However, contrary to what has usually happened, buyers stepped up and bought small-cap stocks...and pretty much everything else. That erased the egregious divergences that had existed. The broadness of the rally was impressive, as it spread across stocks, industries, sectors, and even countries.
When so many markets have traded as well as they did on Friday, on both a medium- and long-term time frame, it has boded well for almost all broad market indexes. Because the U.S. markets have been so strong, their returns have been the most impressive, but even broader indexes that stretch across developed market boundaries showed exceptional returns. This is a compelling sign for diversified investors across the globe.