
All-or-nothing days keep adding up

Key points:
- In 2022, investors have bought or sold stocks in tandem on more than 1 out of every 3 of days
- Days with all-or-nothing swings in stocks account for more than 15% of all sessions
- Similarly severe bouts of volatility since 1928 led to short-term losses and long-term gains
This year has witnessed persistent all-or-nothing days
Days when seemingly everything swings in lockstep have been common in recent months. By the looks of things, we might get another one of those days on Monday.
Bloomberg notes that this year has been one of the most extreme in terms of all-or-nothing days.
Lockstep moves, one day up and the next down, have been sweeping through the market like storms, as paranoia over inflation alternates with optimism the economy can weather it. Tuesday's swing, in which more than 400 companies of the S&P 500 moved in the same direction, is a pattern that has repeated 79 times in 2022, a rate that if sustained would top any year since at least 1997.
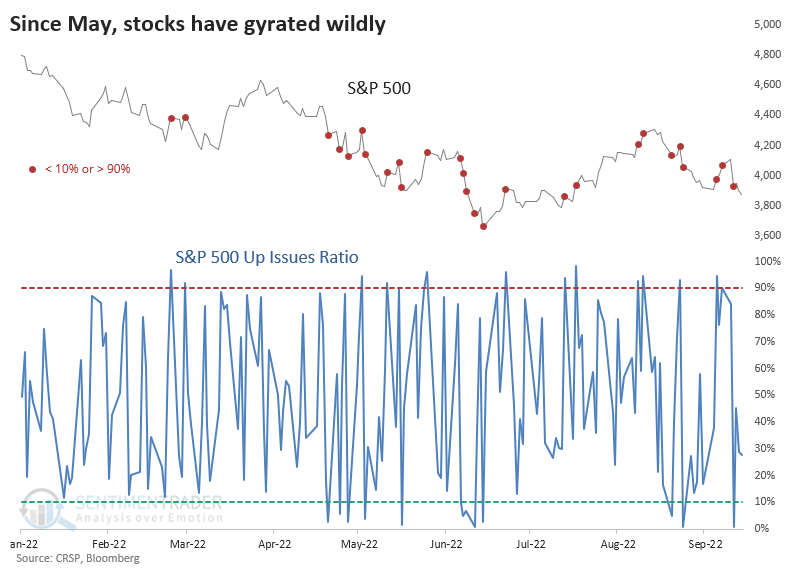
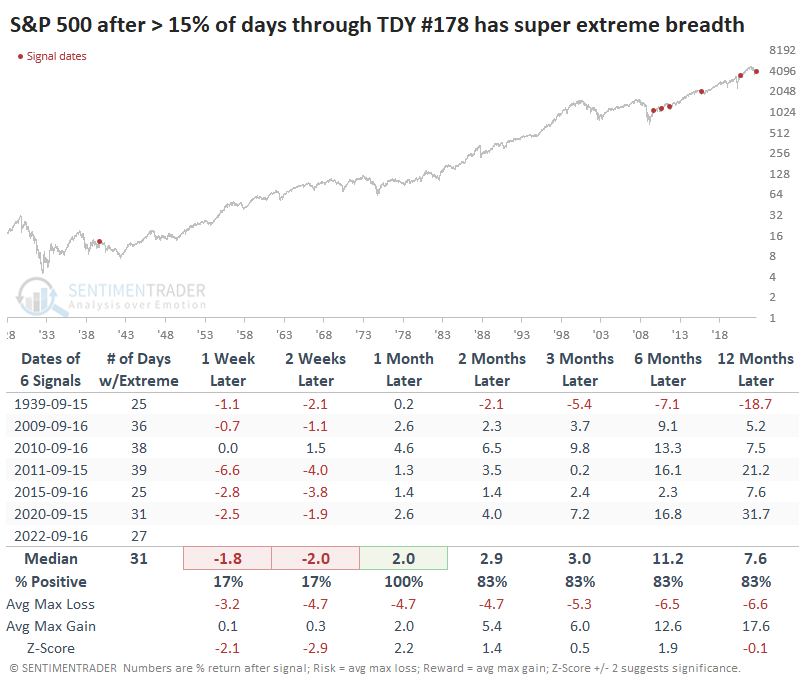
It has undoubtedly been the case that this year has seen its share of index-driven days. The red dots on the chart below highlight sessions when fewer than 10% or more than 90% of stocks in the S&P 500 advanced.
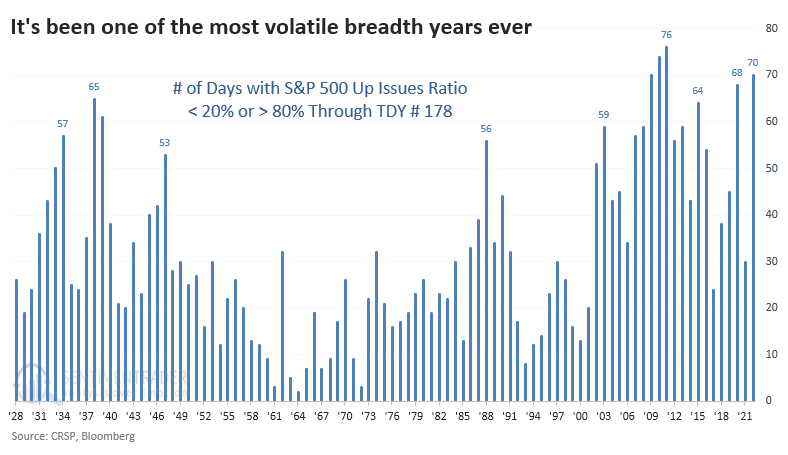
Through Trading Day of the Year (TDY) #178, our data shows that investors have gone mostly one way or the other on 70 sessions. These are moderate extremes, with fewer than 20% or more than 80% of S&P 500 stocks advancing in the session. It ranks among the most extreme years this far into the calendar since 1928.
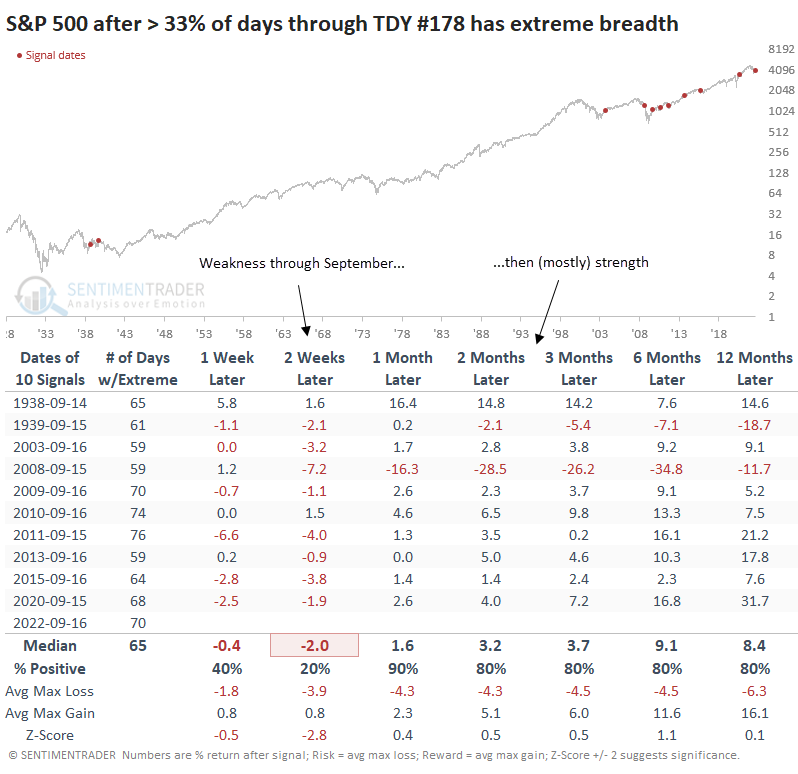
When we've gotten this far into the year and more than a third of days witnessed at least a moderate extreme in breadth, the S&P struggled over the next couple of weeks. The last half of September tends to be a bear. The month(s) ahead witnessed a rebound each time outside of 2008, though 1939 also ended up being a failure.
Even more extreme days are even more common
If we look at even more extreme days, when fewer than 10% or more than 90% of stocks advanced, it's no surprise that 2022 also ranks high. So far this year, there have been 27 such days.
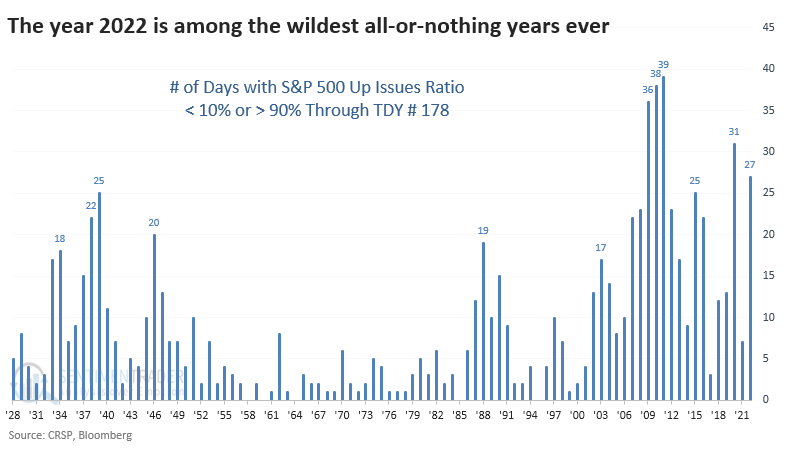
There have only been a handful of years when at least 15% of days witnessed true all-or-nothing days this far into a year. All but one have triggered since the global financial crisis, and all but one preceded losses over the next couple of weeks before (mostly) rebounding.
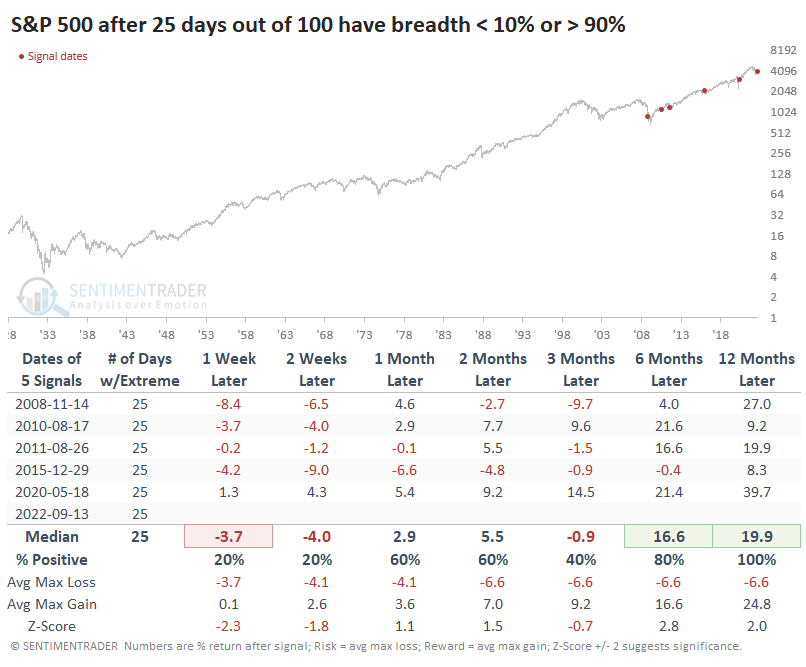
If we forget about the calendar and look at every rolling 100-day stretch, this still ranks among the most volatile all-or-nothing stretches in 94 years. In less than six months, there have been 25 days when investors sold or bought nearly every stock in the S&P.
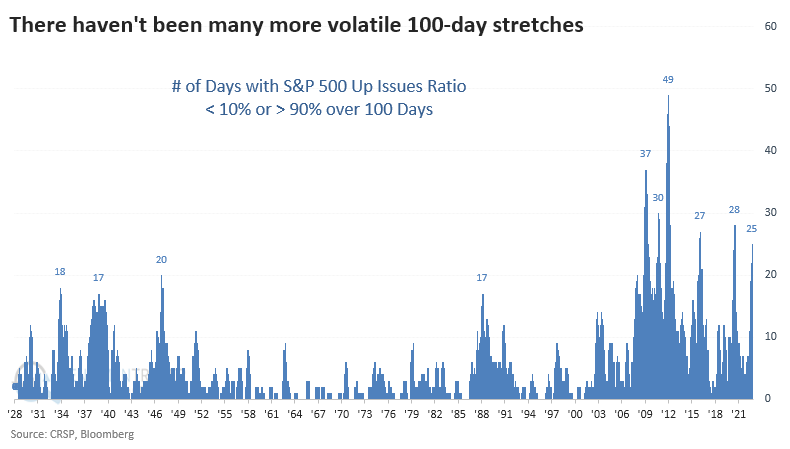
Again, this is not something investors ever suffered through before 2008. Only the post-pandemic swings preceded an uninterrupted rally when it got this volatile. The others, again, saw losses through the end of September and then significant rebounds.
What the research tells us...
This has been one of the most remarkable years in market history. The persistence of selling, near total lack of safe-haven assets, and degree of pessimism into June are among the most severe we've ever seen. That, combined with the buying thrusts witnessed at multiple stages, have typically preceded long-term gains. It's not the kind of activity seen during ongoing bear markets, with the potential exceptions of 2001 and 1973. Still, stocks continue to slide, and until there are signs that buyers are willing to follow through, it remains a hazardous environment.