
All eyes on crude oil and unleaded gas

Key Points
- The war in Ukraine has lit a rocket under energy products
- When a market starts to rally vertically, a) no one knows when the rally will end or how far it will run, but b) when the end comes, the reversal can be swift and severe
- Some key warning signs are beginning to flash in both markets
Parabolic markets in general
There are fewer amazing things to watch than a market (or stock) that has "gone parabolic." We saw it in lumber in 2020 and again in 2021. We are starting to see it today in energy products. It is impossible to predict when or at what price the top will happen when this occurs. Like a rocket, that market will soar until it runs out of fuel.
On the other end, what will happen after the top is typically fairly predictable. Just like a rocket, once the market rally runs out of fuel, the subsequent decline is invariably swift and severe.
Crude Oil
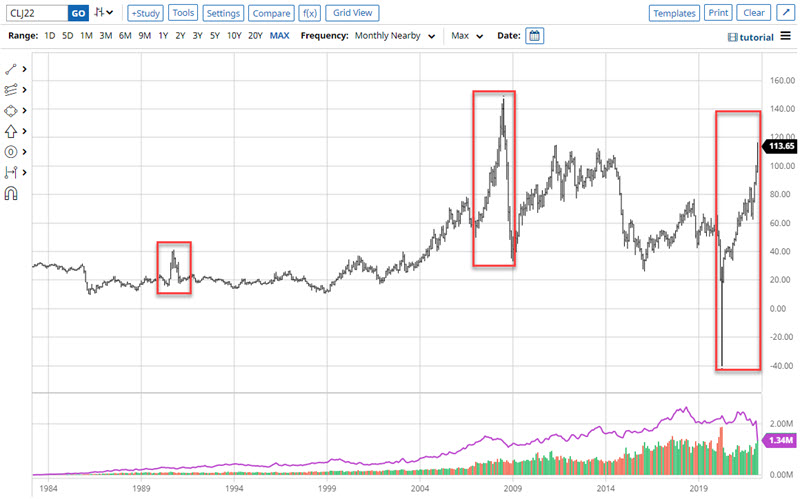
The chart below (courtesy of Barchart.com) displays crude oil futures since 1983. The current rally is visible on the far right. The relevant points of reference occurred in 1990 and 2008.
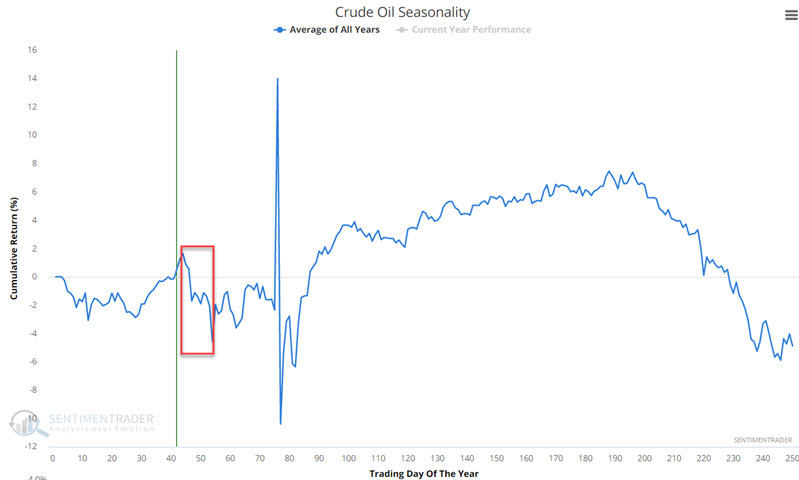
Crude oil seasonality is soon to reach an intermediate peak, as you can see in the chart below. This does not mean that the current rally is about to end. It does suggest that traders pay extremely close attention for signs of a reversal during this timeframe.
Another concern is the recent spike in the term structure for crude oil futures.
The term structure of crude oil futures shows the relationship of the near-term futures contract to a further-out contract. If it is above 1.0, the near-term contract is priced higher than the further-out contract, called backwardation. If below 1.0, then the market is in contango. Severe backwardation (i.e., high term structure indicator readings) typically highlight times when the crude oil is forming a top (although it can take a little while to get there).
The chart below displays all days when crude oil term structure was above 1.20 - including the most recent reading on 3/2/2022.

The table below displays a summary of the results. It is not a pretty picture.
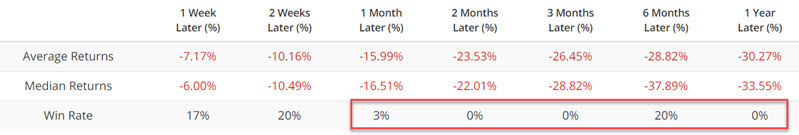
These results do not guarantee a significant reversal in crude in the months ahead. However, they suggest that traders should be prepared for just such an occurrence. Because historical results are strongly negative across the entire 12 months, they suggest waiting for some clear sign of a reversal before considering the short side - i.e., do not attempt to "pick the top," nor sell short into the teeth of a parabolic rally.
Unleaded Gas
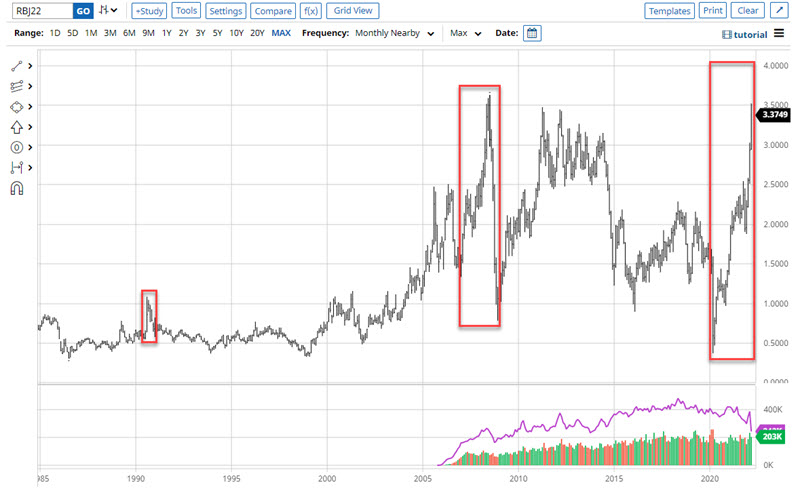
The chart below (courtesy of Barchart.com) displays crude oil futures since 1983. The current rally is visible on the far right. The relevant points of reference occurred in 1990 and 2008.
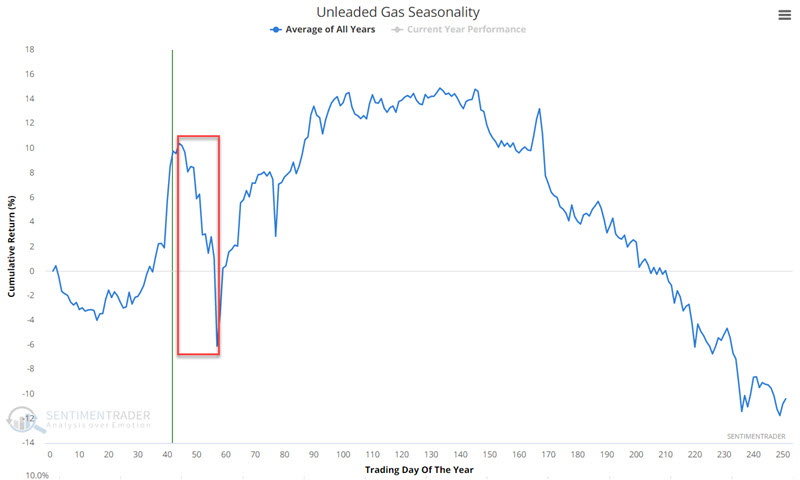
The chart below displays the annual seasonal trend for unleaded gas futures. It, too, is about to enter a seasonally unfavorable period after making the most of the recent favorable period.
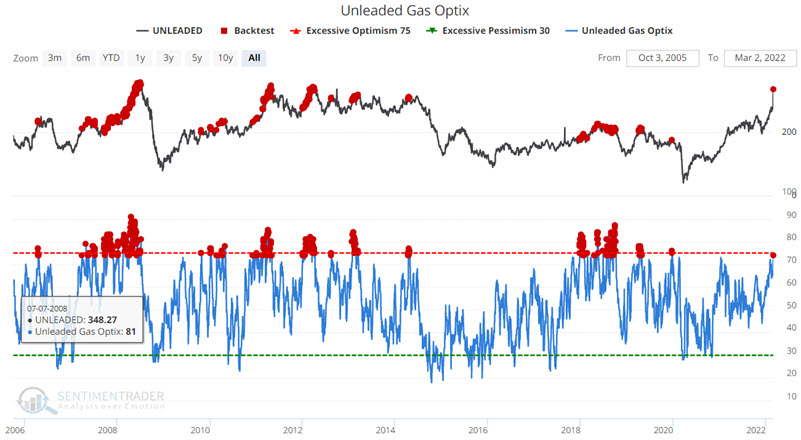
The chart displays all days when unleaded gas Optix was above 73.9. A close look reveals some occasions when price continues to power ahead for quite some time before peaking and other occasions when price tops out in relatively short order. There is no way to predict which scenario will play out this time around.
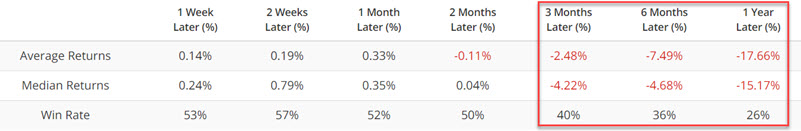
The results are by no means uniformly bearish. However, in the table below, we see a tendency for significant price weakness 3 to 12 months out.
What the research tells us…
There are two takeaways, and they are equally important:
- Parabolic moves have the potential to last longer and extend much further than anyone might reasonably expect
- Once a parabolic move is completed, the reversal can (typically) be expected to be swift and severe
Thoughts on trading crude oil and unleaded gas:
- If you want to play the long side of these markets, first be sure that you have the financial wherewithal to assume significant risk
- If you want to play the short side, be patient, avoid the temptation to pick a top, and wait for a meaningful sign of a reversal before diving in.