Data &
Technology
Research
Reports
Report Solutions
Reports Library
Actionable
Strategies
Free
Resources
Simple Backtest Calculator
Simple Seasonality Calculator
The Kelly Criterion Calculator
Sentiment Geo Map
Public Research Reports
Free Webinar
Pricing
Company
About
Meet Our Team
In the News
Testimonials
Client Success Stories
Contact
Log inLoginSign up
< BACK TO ALL REPORTS

All equity funds are showing negative flows

Jason Goepfert
2020-07-10
Again this week, investors yanked money from equity funds. This is the fourth consecutive week, totaling more than $40 billion in outflows.

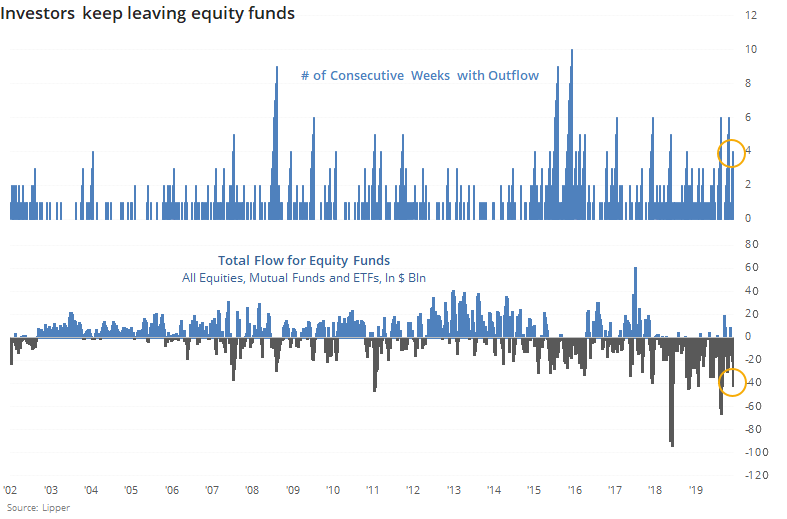
What's it going to take for investors to embrace equity funds again?

They're leaving emerging markets funds, overseas funds, and inexplicably even domestic ones. Lipper reported another outflow of more than a billion dollars from all equity funds this week, the 4th consecutive outflow. The total outflow over the four weeks is over $40 billion, ranking among the largest in nearly 20 years. That's quite remarkable given how resilient parts of the equity market have been.

Generally, big outflows are a decent contrary indicator. Below, we can see every date when there were four straight weeks of outflows, totaling at least $10 billion.

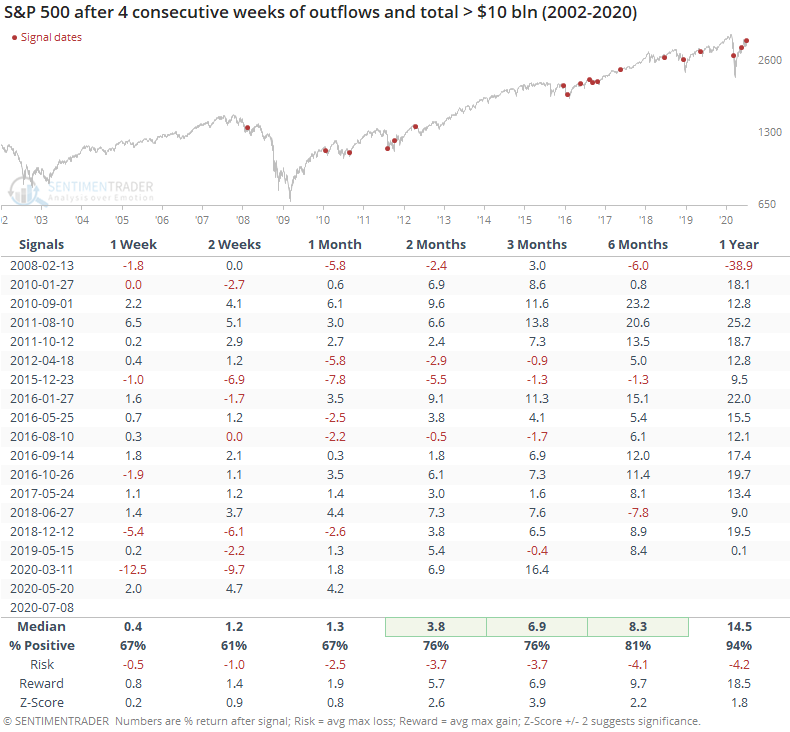
While fund flows don't move perfectly in step with prices, we usually see inflows during rallies and outflows during declines. This year, not so much, and that's a moderately positive sign for stocks over the medium- to long-term.

There are certainly some conflicting data points when it comes to sentiment. We're seeing outflows like this, and insiders are buying. Yet there have also been pockets of historic speculation. Ultimately, these contrasting indicators are washed out in models like Smart and Dumb Money Confidence, where the spread has been hanging around -25%. 

On the Dashboard, we calculate every combination of the two models and show what the S&P's median return over (or under) a random return has been over the next two months given where the models close that day.

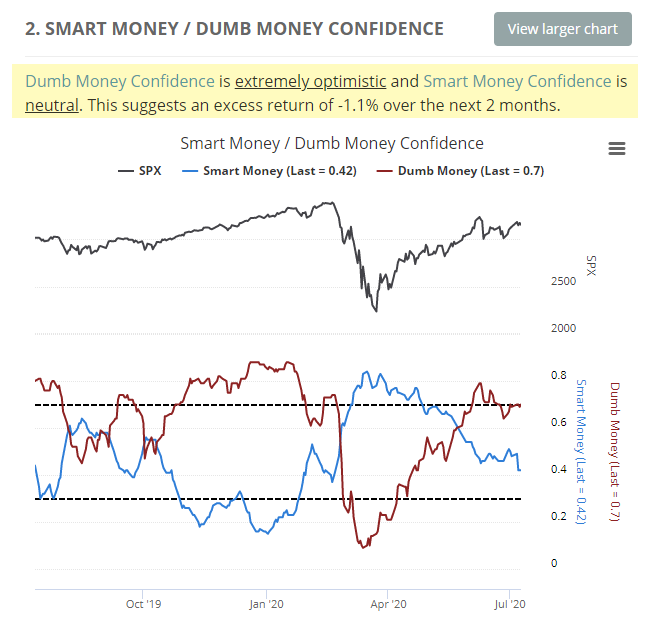
With the current levels of the models where they are, the S&P has under-performed a random return by 1.1% over the next couple of months since 1999. So the few positives among the indicators we follow haven't been enough to offset the multitude of negatives.

The most positive aspects of this market have been the thrusts, recoveries, and trend changes that have an almost unblemished record at preceding higher prices over a 6-12 month time frame. It's the short- to medium-term that has been more of an issue since late May.

Sorry, you don't have access to this report

Upgrade your subscription plan to get access
Go to Dasboard
DATA &
TECHnologies
IndicatorEdge
‍
BackTestEdge
‍
Other Tools
‍
DataEdge API
RESEARCH
reports
Research Solution
‍
Reports Library
‍
actionable
Strategies
Trading Strategies
‍
Smart Stock Scanner
‍
FREE
RESOUrCES
Simple Backtest
Calculator
Simple Seasonality
Calculator
The Kelly Criterion
Calculator
Sentiment Geo Map
‍
Public Research Reports
‍
Free Webinar
COMPANY
‍
About
‍
Meet our Team
‍
In the News
‍
Testimonials
‍
Client Success Stories
Pricing
Bundle pricing
‍
Announcements
‍
FAQ
© 2024 Sundial Capital Research Inc. All rights reserved.
Setsail Marketing
TermsPrivacyAffiliate Program
Risk Disclosure: Futures and forex trading contains substantial risk and is not for every investor. An investor could potentially lose all or more than the initial investment. Risk capital is money that can be lost without jeopardizing ones’ financial security or life style. Only risk capital should be used for trading and only those with sufficient risk capital should consider trading. Past performance is not necessarily indicative of future results.

Hypothetical Performance Disclosure: Hypothetical performance results have many inherent limitations, some of which are described below. No representation is being made that any account will or is likely to achieve profits or losses similar to those shown; in fact, there are frequently sharp differences between hypothetical performance results and the actual results subsequently achieved by any particular trading program. One of the limitations of hypothetical performance results is that they are generally prepared with the benefit of hindsight. In addition, hypothetical trading does not involve financial risk, and no hypothetical trading record can completely account for the impact of financial risk of actual trading. for example, the ability to withstand losses or to adhere to a particular trading program in spite of trading losses are material points which can also adversely affect actual trading results. There are numerous other factors related to the markets in general or to the implementation of any specific trading program which cannot be fully accounted for in the preparation of hypothetical performance results and all which can adversely affect trading results.

Testimonial Disclosure: Testimonials appearing on this website may not be representative of other clients or customers and is not a guarantee of future performance or success.