
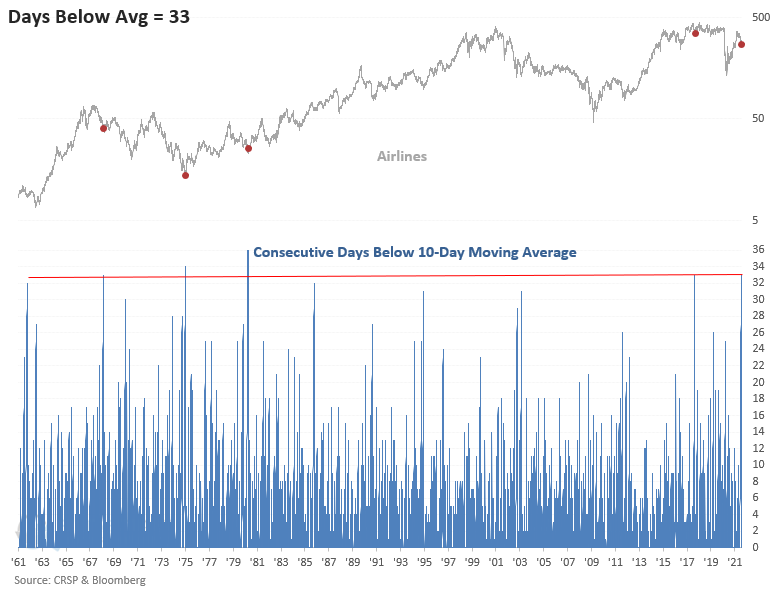
Airlines - The Downside Momentum Ends

The Airline's consecutive days below the 10-day moving average count came to an end on Wednesday when the group closed back above the average. In a note on 7/21/21, I shared the following thoughts around the oversold condition in the energy sector. I'm sharing them again as the airline industry provides us with a similar opportunity.
When an opportunity like the current one unfolds, a trader or investor has to make a choice. Do we immediately buy the oversold condition, or do we wait for momentum to turn back up before initiating a position? A third choice could be purchasing half of our position on the oversold condition and the other half once a momentum signal occurs. In my opinion, each method has a time and place depending on the market environment and one's risk tolerance.
Let's review an actionable signal concept for the consecutive days below the moving count indicator in light of a new alert from the airline industry on Wednesday. The following concept represents choice number two. i.e., when momentum turns back up.
THE CONCEPT
The moving average count reversal signal identifies when a stock, index, ETF, or commodity closes below its 10-day moving average for a user-defined number of days and then reverses higher to close above the 10-day average. The model will issue an alert based upon the following conditions.
SIGNAL CRITERIA FOR AIRLINES
- The days below the 10-day moving average count crosses above 25. i.e., the oversold reset condition.
- If the reset condition is confirmed and the airline index closes above its 10-day moving average, then buy.
Please remember that the optimal reset count will vary depending on the individual security. I would also note that it's always essential to understand the broad market backdrop when playing mean-reversion signals. i.e., trading signals could have different outcomes in a bull market versus a bear market.
HISTORICAL CHART
The airline index traded below its 10-day moving average for 33 consecutive days before ending the streak on Wednesday by closing back above the 10-day average. As the chart shows, that's only happened four other times in 60+ years.
TRADING STATISTICS
The trading statistics in the table below reflect the optimal days-in-trade holding period of 26 days. When I run optimizations for trading signals, I cap the max number of days at 42.
The profit factor looks solid, with a $12 gain for every $1 lost.

HOW THE SIGNALS PERFORMED
Aside from a few instances in the late '60s and the 1-year pandemic crash timeframe, the results look pretty good, especially the 6-month window. I think of the airline industry as a group to rent for a trade versus a buy-and-hold strategy.
