Data &
Technology
Research
Reports
Report Solutions
Reports Library
Actionable
Strategies
Free
Resources
Simple Backtest Calculator
Simple Seasonality Calculator
The Kelly Criterion Calculator
Sentiment Geo Map
Public Research Reports
Free Webinar
Pricing
Company
About
Meet Our Team
In the News
Testimonials
Client Success Stories
Contact
Log inLoginSign up
< BACK TO ALL REPORTS

Aggregate model goes negative

Jason Goepfert
2020-04-02
The Aggregate Signal Model has quickly lost ground, closing below 45% as of Wednesday. That has historically been a dividing line between healthy and unhealthy markets, which is a worry if it can't recover in the coming weeks.

In recent days, several of the Buy/Sell Signals have flipped to cash, from being invested in either SPY or QQQ.

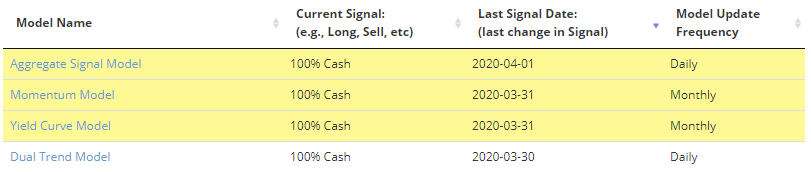
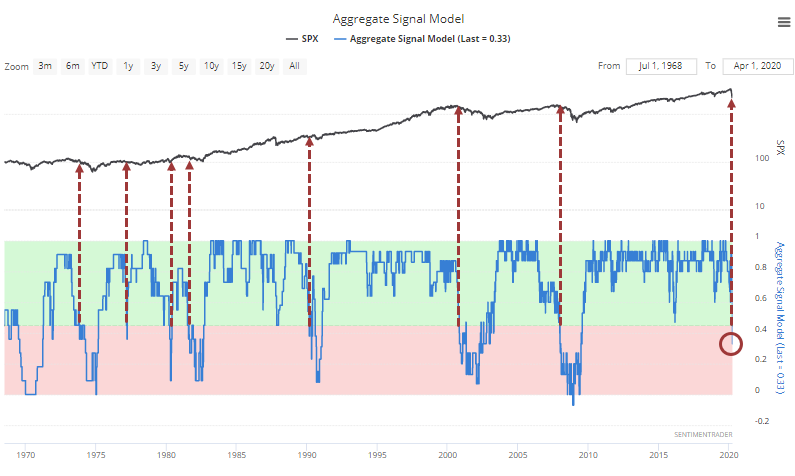
In response, the Aggregate Signal Model, which sums up the percentage of models currently on a buy signal, dropped below the 45% threshold. In healthy markets, it usually stays well above that level.

Many of the models include economic data which are subject to revision, but we only include real-time data that one can use at the time of release. And economic data released recently is more likely to be revised down, not up.

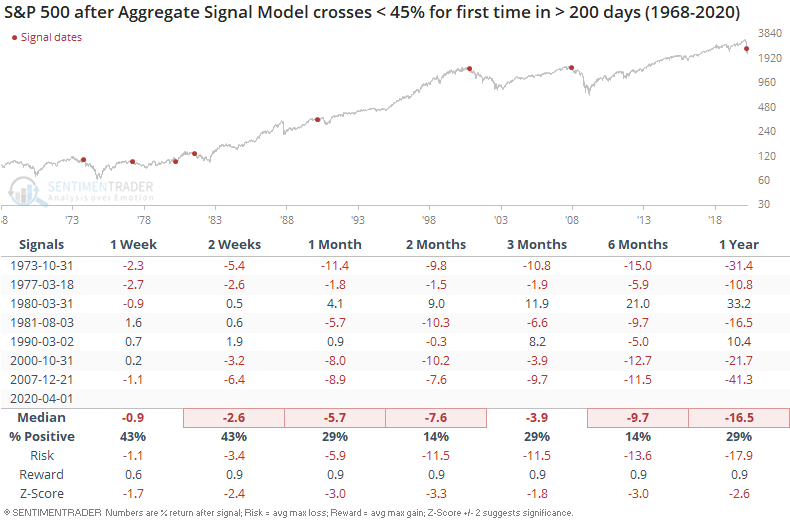
A model reading this low this has not been a good sign.

There are some extenuating circumstances:

  1. The Aggregate now includes more daily models, which could make the signal nosier than it was historically, so we might see it quickly jump back above 45% if buyers return in force
  2. This sell signal triggered after the quickest, most severe decline in history (in some respects), not a slow-rolling one like most of the others
  3. We've already seen the kind of panic and subsequent buying thrust that have typically occurred well after the other signals turned negative

If we see stocks continue to recover, then the model could flip back above 45% in the coming weeks. That would be unusual - the only other times it did so were in 1977 and 1990 - but if it did, it would be "less bad." Those were two of the more mild signals.

The biggest trouble came when the model stayed below 45% for weeks and months at a time. Again, most of the other signals triggered when stocks were closer to their highs than now, so perhaps the worst of the losses have already happened. It's just that it would be a better sign if the model was able to rebound as opposed to staying below 45%.

DATA &
TECHnologies
IndicatorEdge
‍
BackTestEdge
‍
Other Tools
‍
DataEdge API
RESEARCH
reports
Research Solution
‍
Reports Library
‍
actionable
Strategies
Trading Strategies
‍
Smart Stock Scanner
‍
FREE
RESOUrCES
Simple Backtest
Calculator
Simple Seasonality
Calculator
The Kelly Criterion
Calculator
Sentiment Geo Map
‍
Public Research Reports
‍
Free Webinar
COMPANY
‍
About
‍
Meet our Team
‍
In the News
‍
Testimonials
‍
Client Success Stories
Pricing
Bundle pricing
‍
Announcements
‍
FAQ
© 2024 Sundial Capital Research Inc. All rights reserved.
Setsail Marketing
TermsPrivacyAffiliate Program
Risk Disclosure: Futures and forex trading contains substantial risk and is not for every investor. An investor could potentially lose all or more than the initial investment. Risk capital is money that can be lost without jeopardizing ones’ financial security or life style. Only risk capital should be used for trading and only those with sufficient risk capital should consider trading. Past performance is not necessarily indicative of future results.

Hypothetical Performance Disclosure: Hypothetical performance results have many inherent limitations, some of which are described below. No representation is being made that any account will or is likely to achieve profits or losses similar to those shown; in fact, there are frequently sharp differences between hypothetical performance results and the actual results subsequently achieved by any particular trading program. One of the limitations of hypothetical performance results is that they are generally prepared with the benefit of hindsight. In addition, hypothetical trading does not involve financial risk, and no hypothetical trading record can completely account for the impact of financial risk of actual trading. for example, the ability to withstand losses or to adhere to a particular trading program in spite of trading losses are material points which can also adversely affect actual trading results. There are numerous other factors related to the markets in general or to the implementation of any specific trading program which cannot be fully accounted for in the preparation of hypothetical performance results and all which can adversely affect trading results.

Testimonial Disclosure: Testimonials appearing on this website may not be representative of other clients or customers and is not a guarantee of future performance or success.