
After a modest pullback, buyers come back in a historic way

Deeply oversold...then really, really not
At the end of November, selling pressure was concentrated enough to push the 10-day average of NYSE Up Volume below 40%. By December 1, that 10-day average dropped to 34%, oversold enough to be in the bottom 2% of all days since 1962.
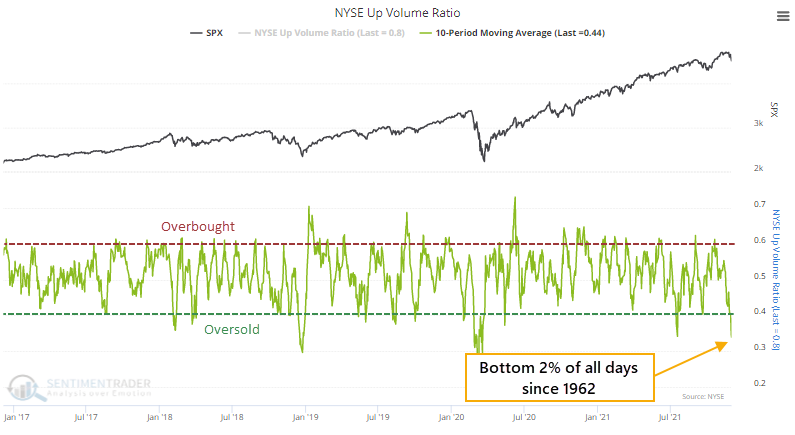
Since then, it's been a buying frenzy. Out of the last 4 sessions, 3 saw more than 80% of volume focused on advancing securities.
The reversal from oversold conditions to persistent and heavily skewed buying interest has triggered a breadth thrust with an excellent track record.
We spent a lot of time last March/April/May looking at breadth thrusts from various vantage points. The market didn't necessarily record "official" thrust signals as outlined by Marty Zweig or others. As noted at the time, that didn't mean investors' sudden interest in buying was invalidated.
And here we are again.

| Stat box Traders pulled more than $575 million from the TLT bond fund on Wednesday, the 5th-largest outflow of the year. This is on the heels of an average inflow of more than $400 million per day over the prior 10 days, a record high for the fund. |
But watch larger macro factors
The chart below displays the Bear Market - Macro Index Spread.
Jay pointed out that this indicator shows the spread between the Bear Market Probability indicator and our Macro Index model. The higher the indicator, the greater the probability of a new bear market, combined with deteriorating fundamental macro conditions, negative for stocks. The lower the indicator, the lower the probability of a significant decline, usually combined with improving macro conditions, which is positive for stocks.
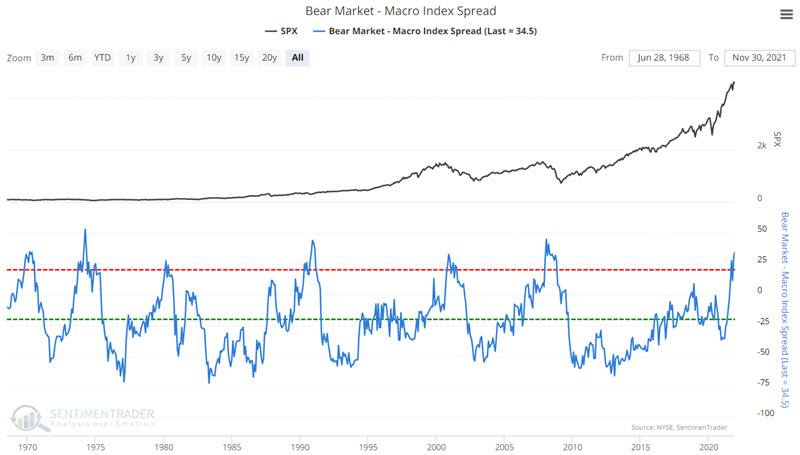
Over the past 50+ years, the S&P 500 Index has achieved all of its net gain (and more) while this Bear Market Probability minus Macro Index Spread strategy was on a buy signal. While we do not necessarily recommend the use of this as a standalone strategy, as part of a larger "weight of the evidence" approach, this model can offer valuable risk-on/risk-off information. This particular model is presently in "risk-off" mode, so we'll have to see if the recent surge in buying interest and signs of pessimism will be enough to counter some of these contradictory forces.

Traders moved too far into inverse funds
Stock market inverse ETFs are a relatively new tool for expressing a short position in a particular index or sector. So, when inverse ETF volume surges relative to NYSE composite volume, investors or traders are concerned about the stock market and implement a hedge or speculative bet on a decline.
The volume ratio between the two series can be a contrary indicator to identify an environment where sentiment has become too pessimistic. When sentiment becomes too bearish, the stock market rallies.
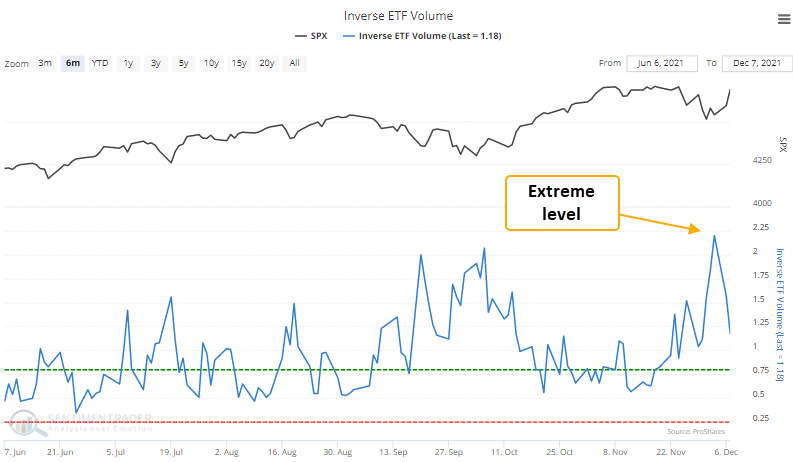
Dean created a signal that looks at this volume relative to its range over several months, and created thresholds to determine when a meaningful shift takes place.
This signal has triggered 33 other times over the past 12 years. After the others, future returns and win rates were excellent across almost all time frames, especially the 2-month window.