Data &
Technology
Research
Reports
Report Solutions
Reports Library
Actionable
Strategies
Free
Resources
Simple Backtest Calculator
Simple Seasonality Calculator
The Kelly Criterion Calculator
Sentiment Geo Map
Public Research Reports
Free Webinar
Pricing
Company
About
Meet Our Team
In the News
Testimonials
Client Success Stories
Contact
Log inLoginSign up
< BACK TO ALL REPORTS

After 17 Months of Speculation, Investors Are in Risk-Off Mode

Jason Goepfert
2021-10-05
For the first time in well over a year, investors are showing risk-off behavior and widespread signs of pessimism.

For the first time in over a year, investors have a risk-off mentality and are showing signs of widespread pessimism.

It's not extreme in most cases, and Friday's rebound puts a dent in the argument, but last week showed the first real signs of concern since the spring of 2020.

The Risk-On / Risk-Off Indicator looks at more than 20 indicators and calculates the percentage that are displaying risk-on or risk-off behaivor. You can see them individually by going to Spotlights > Spotlight on Sentiment. The two other times that the indicator tipped into risk-off territory over the past year, buying pressure came in immediately. Last week was the first time that didn't happen.

Risk on risk off indicator

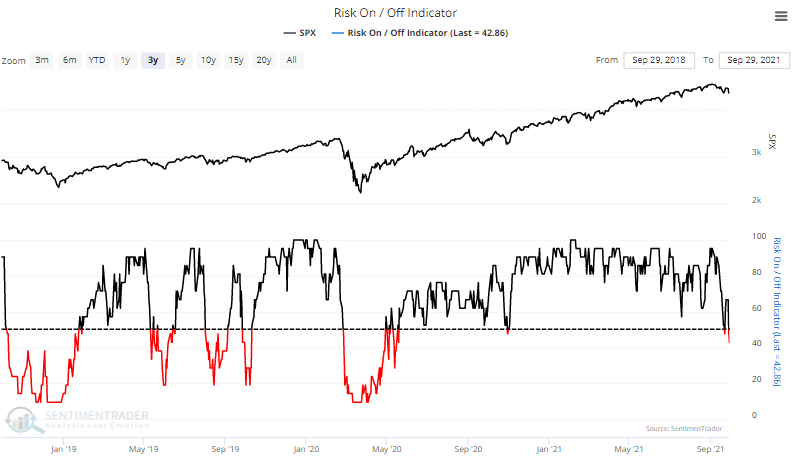
That ended the longest streak ever of the Risk-On / Risk-Off Indicator being above 50% on consecutive days.

After other long streaks of risk-on behavior finally ended, it didn't prove to be a negative sign for stocks. As we repeat often, momentum (and optimistic behavior) does not die easily. While the S&P 500 suffered some short-term volatility, it consistently rebounded in the months ahead. Over the next 6-12 months, there was only a single small loss.


What else we're looking at

  • Full returns following the ends of long streaks of risk-on behavior
  • The spread between Smart Money and Dumb Money Confidence has reached an extreme
  • An update on absolute and relative trends in industry, sector, and country ETFs
  • A broad look at upcoming seasonal trends in commodities

Stat box

On Monday, the S&P 500 lost more than 1% but only 45% of NYSE volume flowed into declining issues. That's among the lowest downside volume since 1965 on a day the S&P 500 declined by 1% or more.

Etcetera

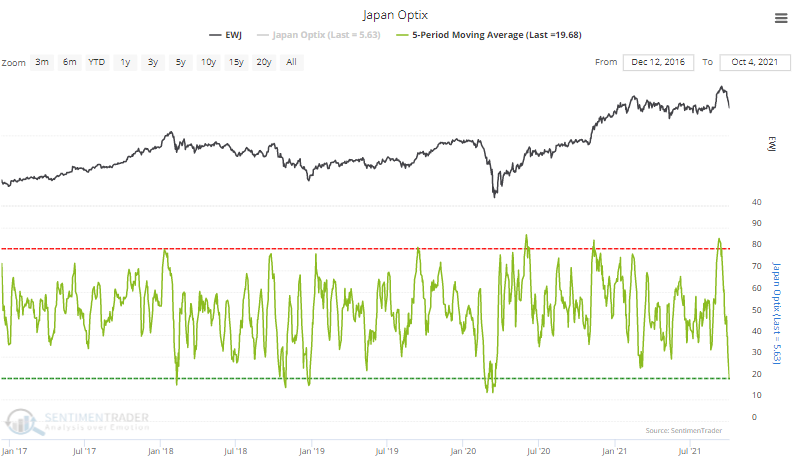
About-face. The Optimism Index on the EWJ Japan fund has tanked. A 5-day average of the indicator has cycled from above 80% to below 20%, one of its lowest readings of the past 5 years.

ewj japan optimism index sentiment

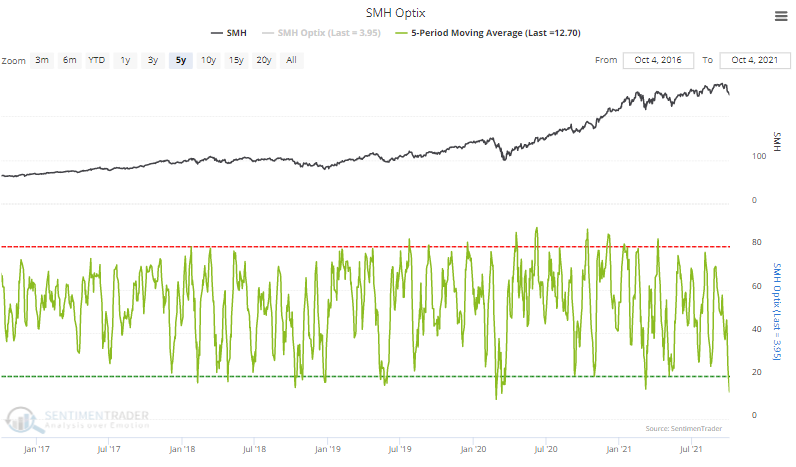
Semi-pessimistic. Optimism on semiconductor stocks has plunged as well. The 5-day average Optimism Index on SMH has dropped below 13%, the 2nd-lowest reading in 5 years.

smh semiconductor optimism index sentiment

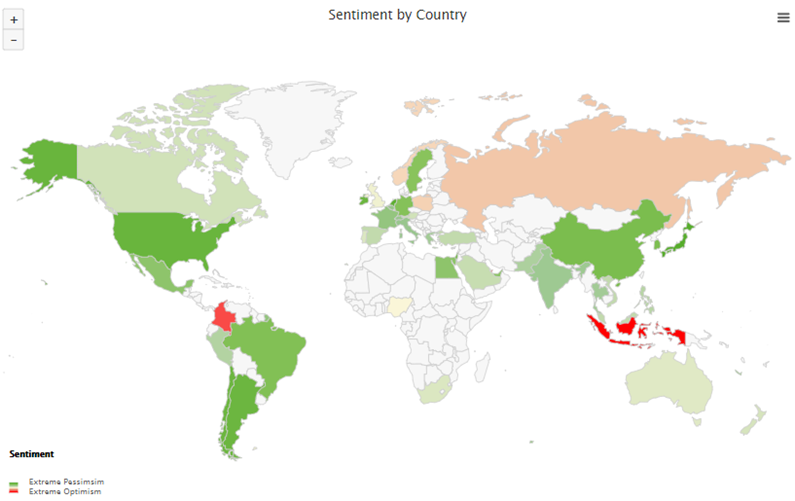
Widespread pessimism. The global sell-off has created deep pessimism around the world. Our Geo-Map shows optimism in Colombia and Indonesia, but deep green (extreme pessimism) in many other areas of the globe.

optimism index geo map sentiment world

DATA &
TECHnologies
IndicatorEdge
‍
BackTestEdge
‍
Other Tools
‍
DataEdge API
RESEARCH
reports
Research Solution
‍
Reports Library
‍
actionable
Strategies
Trading Strategies
‍
Smart Stock Scanner
‍
FREE
RESOUrCES
Simple Backtest
Calculator
Simple Seasonality
Calculator
The Kelly Criterion
Calculator
Sentiment Geo Map
‍
Public Research Reports
‍
Free Webinar
COMPANY
‍
About
‍
Meet our Team
‍
In the News
‍
Testimonials
‍
Client Success Stories
Pricing
Bundle pricing
‍
Announcements
‍
FAQ
© 2024 Sundial Capital Research Inc. All rights reserved.
Setsail Marketing
TermsPrivacyAffiliate Program
Risk Disclosure: Futures and forex trading contains substantial risk and is not for every investor. An investor could potentially lose all or more than the initial investment. Risk capital is money that can be lost without jeopardizing ones’ financial security or life style. Only risk capital should be used for trading and only those with sufficient risk capital should consider trading. Past performance is not necessarily indicative of future results.

Hypothetical Performance Disclosure: Hypothetical performance results have many inherent limitations, some of which are described below. No representation is being made that any account will or is likely to achieve profits or losses similar to those shown; in fact, there are frequently sharp differences between hypothetical performance results and the actual results subsequently achieved by any particular trading program. One of the limitations of hypothetical performance results is that they are generally prepared with the benefit of hindsight. In addition, hypothetical trading does not involve financial risk, and no hypothetical trading record can completely account for the impact of financial risk of actual trading. for example, the ability to withstand losses or to adhere to a particular trading program in spite of trading losses are material points which can also adversely affect actual trading results. There are numerous other factors related to the markets in general or to the implementation of any specific trading program which cannot be fully accounted for in the preparation of hypothetical performance results and all which can adversely affect trading results.

Testimonial Disclosure: Testimonials appearing on this website may not be representative of other clients or customers and is not a guarantee of future performance or success.