
Absolute & Relative Trend Update

The goal of today's note is to provide you with some insight into what I am seeing with my absolute and relative trend following indicators for domestic and international ETFs.
Data as of 8/27/21 close. All relative comparisons are versus the S&P 500 ETF (SPY). For absolute and relative indicator definitions, please scroll down to the end of the note.
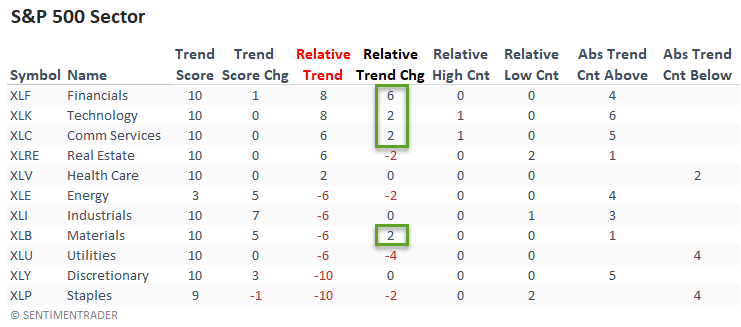
ABSOLUTE & RELATIVE TRENDS - SECTOR ETFS
Financials continued to improve and registered a six-point jump in their relative trend score on a w/w basis.
Technology, communication services, and materials showed a more modest increase in relative scores.
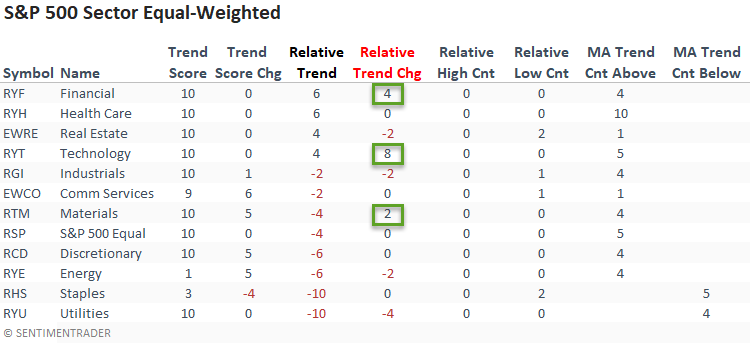
The equal-weighted financials confirmed the strength in the cap-weighted data with an increase in their relative trend score.
I would note the sizable relative trend score increase in the Technology sector.
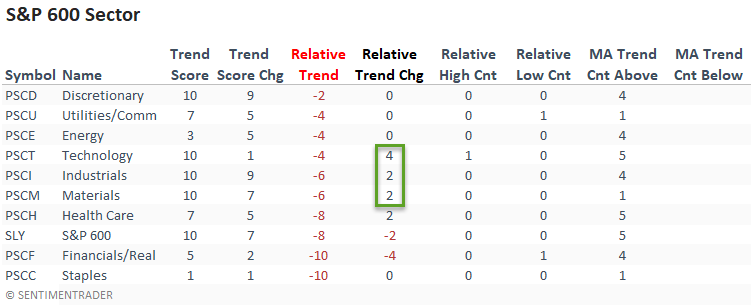
Small-caps continue to show zero sectors with a positive relative trend score versus the S&P 500. However, some groups improved, with the most notable gain coming from the technology sector.
I'm keeping a close eye on small caps. Please see the following intraday note for a signal that suggests that the trading range could resolve itself to the upside.
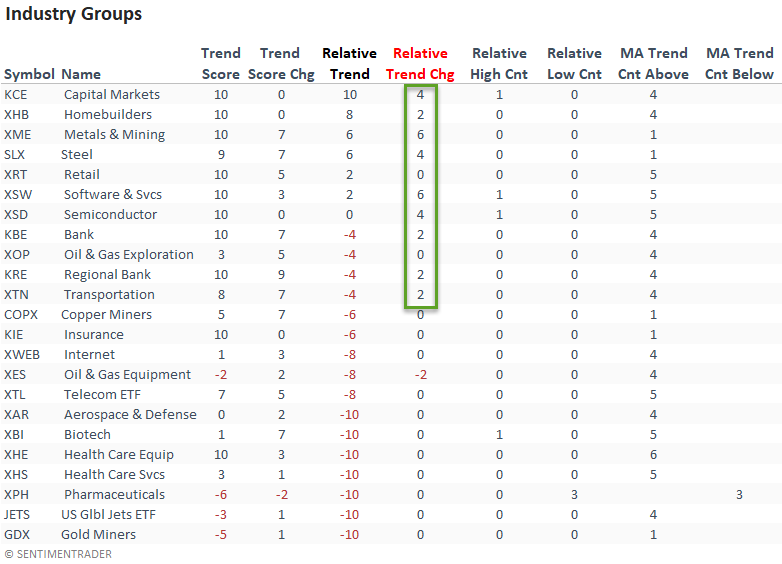
ABSOLUTE & RELATIVE TRENDS - INDUSTRIES
Suppose you sort the industry table according to the relative trend change. In that case, we see an improvement from several cyclical industries.
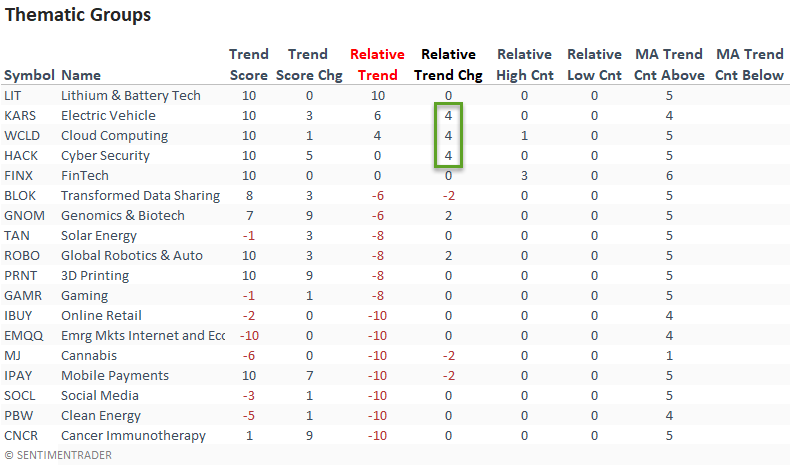
ABSOLUTE & RELATIVE TRENDS - THEMATIC ETFS
The relative trends for thematic groups continue to look unfavorable except for a handful of groups.
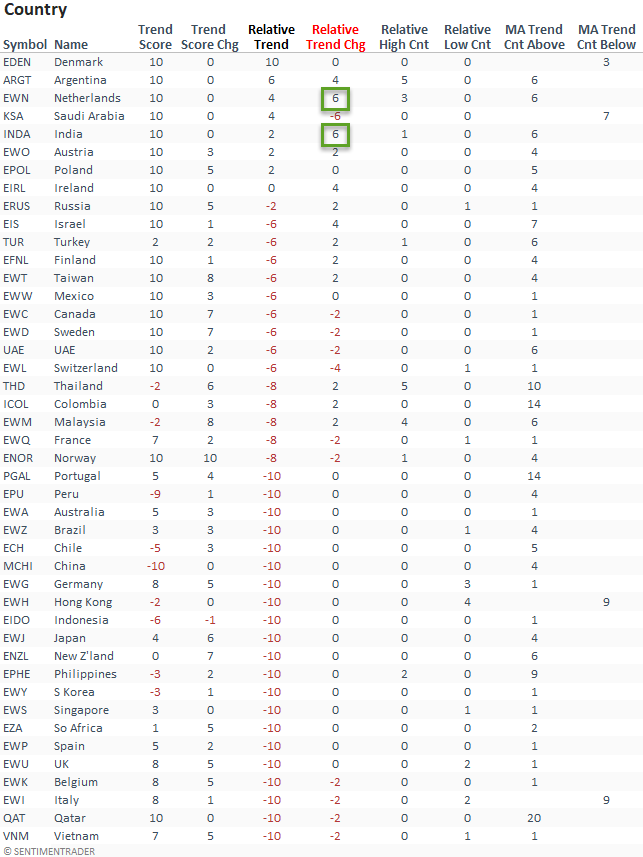
ABSOLUTE & RELATIVE TRENDS - COUNTRIES
Suppose I sort the Country table by the relative trend score column. In that case, it shows a significant number of countries with an unfavorable relative profile compared to the S&P 500 index.
An emerging market country, India recorded a notable jump in its relative trend score.
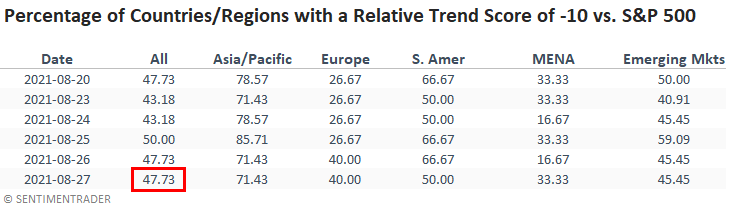
The percentage of countries with a relative trend score of -10 remains at a level that suggests negative forward returns for a broad-based global allocation.
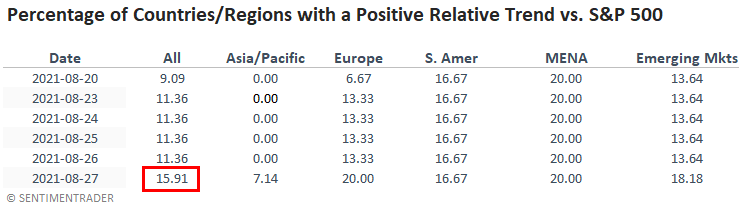
GLOBAL RELATIVE TRENDS
The percentage of countries with a positive relative trend score versus the S&P 500 increased on a w/w basis. The current level suggests an unfavorable environment for the MSCI ACWI World Index ex USA.
ALL COUNTRY RELATIVE TREND CHART
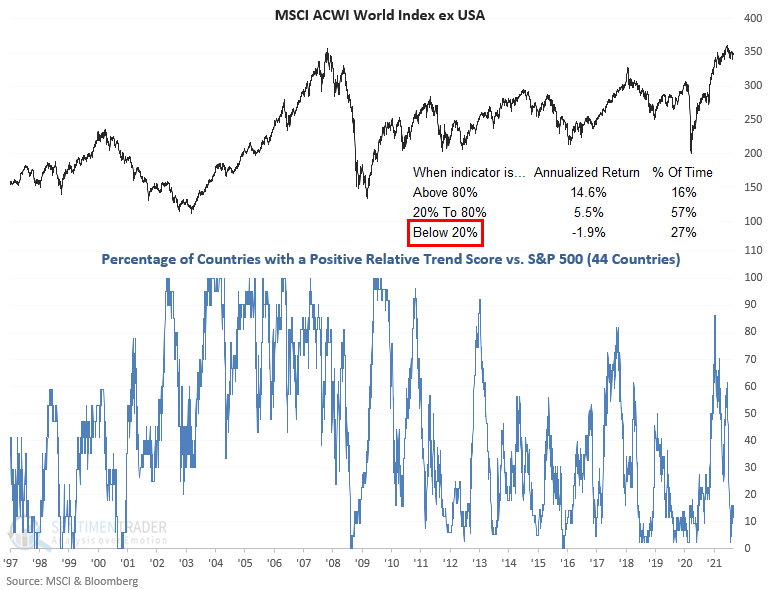
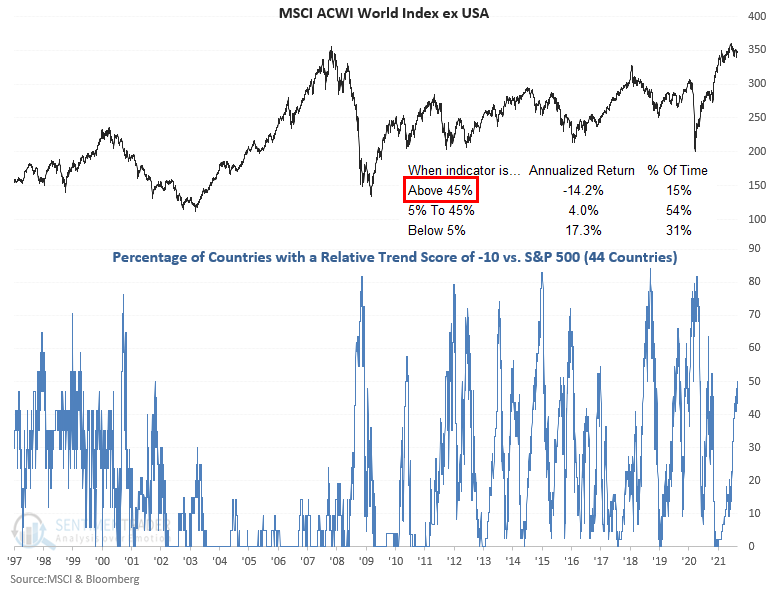
The percentage of countries with a relative trend score of -10 versus the S&P 500 remains at a level that suggests negative returns for the MSCI ACWI World Index ex USA.
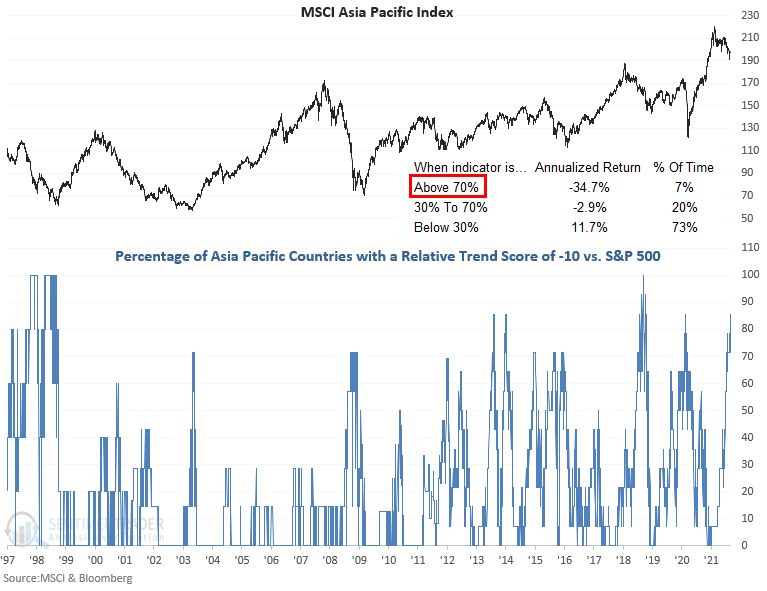
The percentage of countries in the Asia Pacific region with a relative trend score of -10 remains at a level that is concerning.
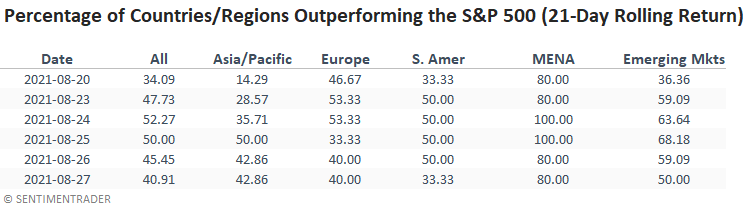
In a note on 7/7/21, I shared a study that assessed the forward return outlook for stocks when the percentage of countries outperforming the S&P 500 on a rolling 21-day basis falls to a low level. Here's a snapshot of the indicator broken down by worldwide regions.
ABSOLUTE AND RELATIVE TREND COLUMN DEFINITIONS
- Absolute Trend Count Score - The absolute trend model contains ten indicators to assess absolute trends across several durations.
- Absolute Trend 5-Day Change - This indicator measures the 5-day net change in the absolute trend model.
- Relative Trend Count Score - The relative trend model contains ten indicators to assess relative trends vs. the S&P across durations.
- Relative Trend 5-Day Change - This indicator measures the 5-day net change in the relative trend model.
- Relative High Count - This indicator measures the number of 21-day relative highs vs. the S&P 500 in the last 5 days.
- Relative Low Count - This indicator measures the number of 21-day relative lows vs. the S&P 500 in the last 5 days.
- Absolute and Relative Trend Scores range from 10 (Best) to -10 (Worst)
- MA Trend Cnt Above - This indicator counts the number of consecutive days above the 10-day moving average.
- MA Trend Cnt Below - This indicator counts the number of consecutive days below the 10-day moving average.