
Absolute & Relative Trend Update

The goal of today's note is to provide you with some insight into what I am seeing with my absolute and relative trend following indicators for domestic and international ETFs.
Data as of 10/22/21 close. All relative comparisons are versus the S&P 500 ETF (SPY). For absolute and relative indicator definitions, please scroll down to the end of the note.
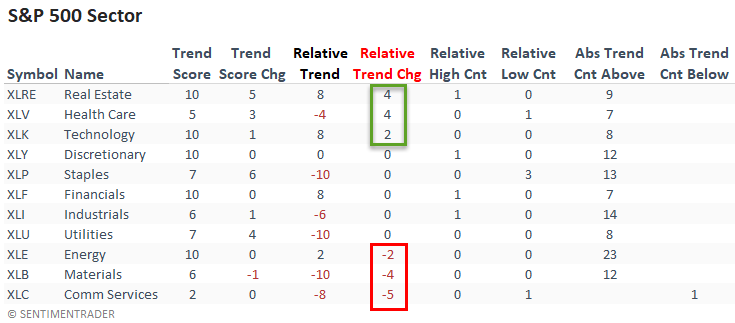
ABSOLUTE & RELATIVE TRENDS - SECTOR ETFS
The relative trend score change column shows that growth-oriented sectors like technology and health care improved at the expense of resource-based groups like energy and materials.
The communication services sector came under pressure late in the week and now shows the weakest relative trend score since February 2020.
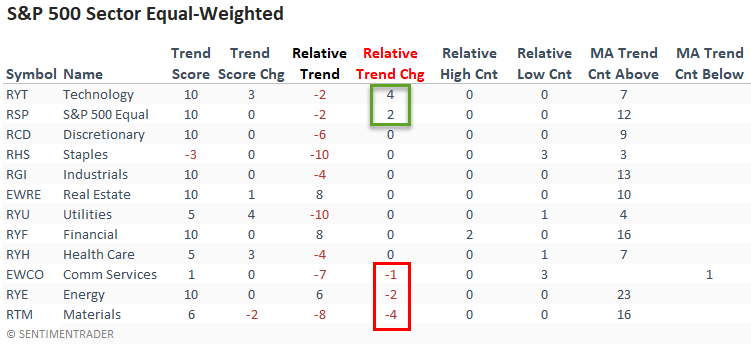
The equal-weighted sector data confirmed the changes in the cap-weighted data with improvement in technology and a deterioration in energy, materials, and communication services.
Interestingly, the equal-weight S&P 500 or average stock improved at the expense of the cap-weighted version.
I would note that financials were the only group to register a relative high last week.
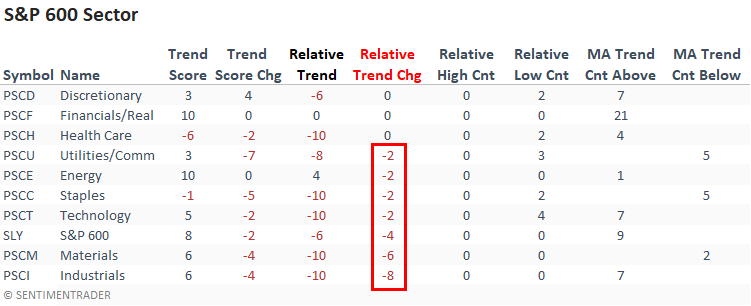
Small-cap stocks had a rough week. Several groups showed a meaningful deterioration in their respective absolute and relative trend scores. And, I would note that the small-cap technology sector did not confirm the strength seen in the large-cap data. For the second straight week, not a single small-cap group registered a new relative high versus the S&P 500.
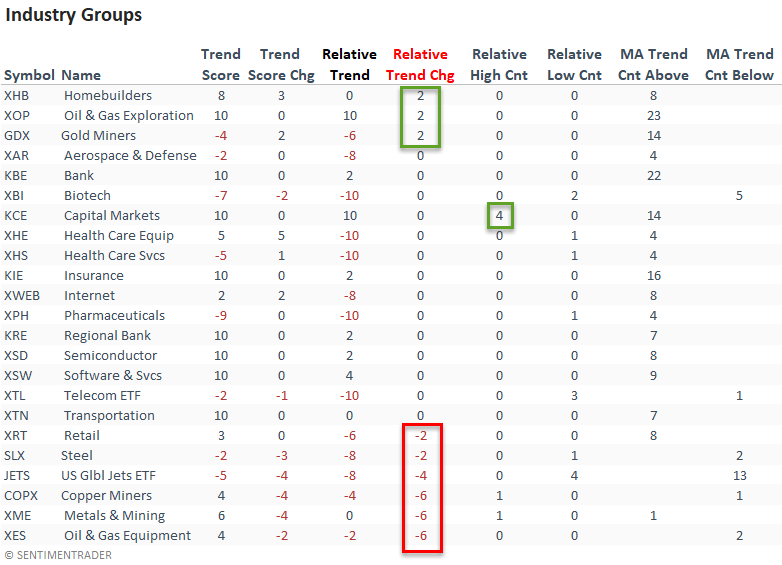
ABSOLUTE & RELATIVE TRENDS - INDUSTRIES
Suppose you sort the industry table according to the relative trend change. In that case, we see a mixed picture from cyclical industries. Homebuilders and oil & gas exploration improved as retail, steel, and copper deteriorated.
The capital markets ETF continues to look solid, and I would note that it registered a new relative high on 4/5 days last week.
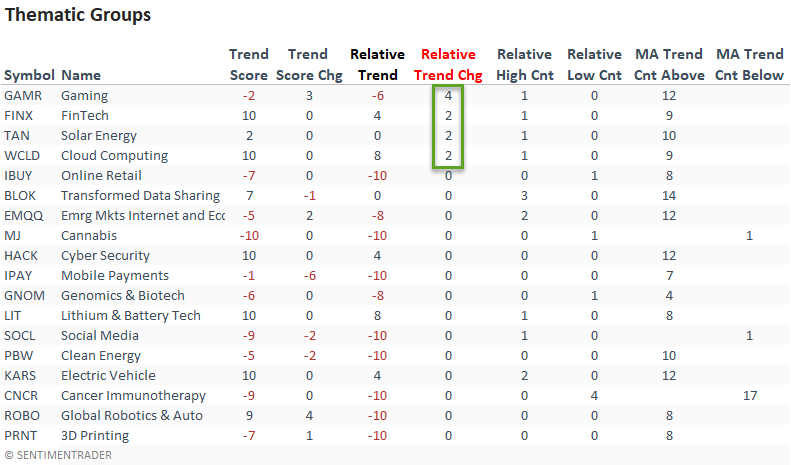
ABSOLUTE & RELATIVE TRENDS - THEMATIC ETFS
Suppose you sort the thematic ETF table according to the relative trend change column. In that case, we see more relative trend score gains than losses.
The cloud computing and lithium & battery technology ETFs continue to maintain solid absolute and relative trend scores.
ABSOLUTE & RELATIVE TRENDS - COUNTRIES
Suppose I sort the Country table by the relative trend score change column. In that case, it shows a deterioration from a significant number of countries. Mexico and South Africa were the most notable.
If we compare relative highs to relative lows, we see that lows outpaced highs by a considerable number. 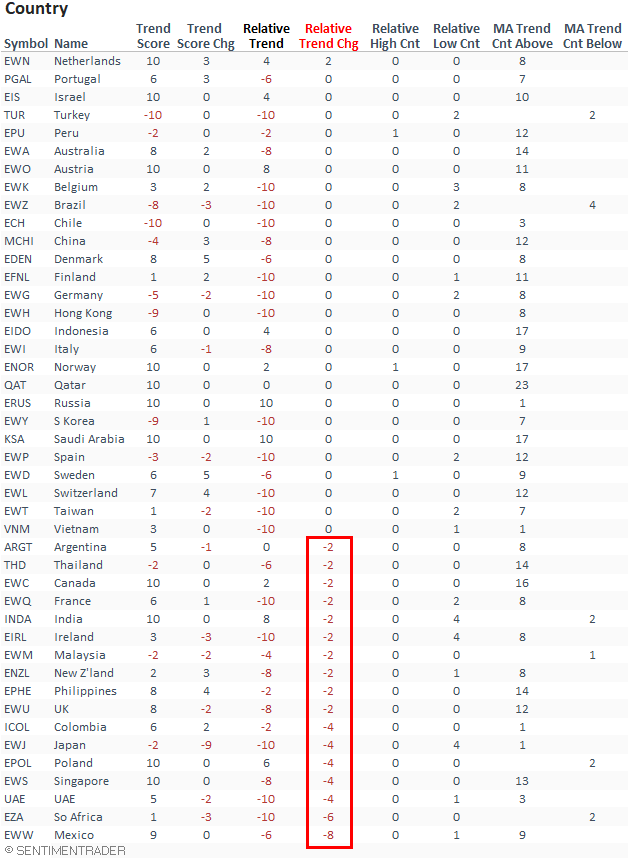
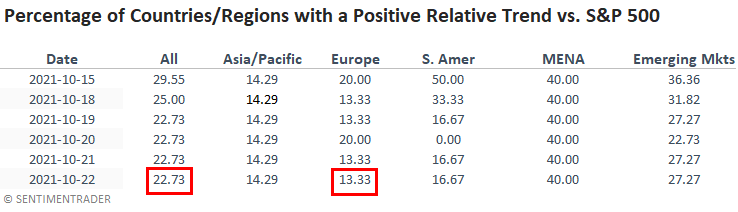
GLOBAL RELATIVE TRENDS
The percentage of countries with a positive relative trend score versus the S&P 500 declined on a w/w basis. If we look at the regional data, we see that most of the deterioration occurred in Europe and South America. At the same time, the Asia Pacific region held steady.
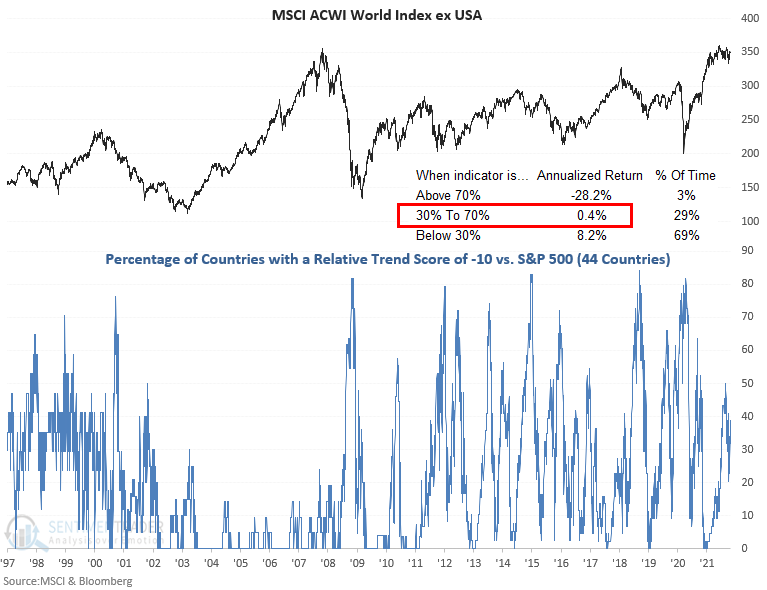
The current all-country data continues to suggest an unfavorable environment for the MSCI ACWI World Index ex USA.
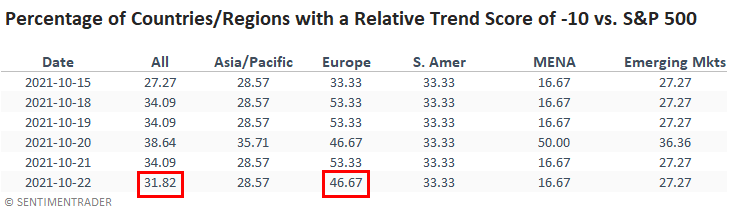
ALL COUNTRY RELATIVE TREND CHART
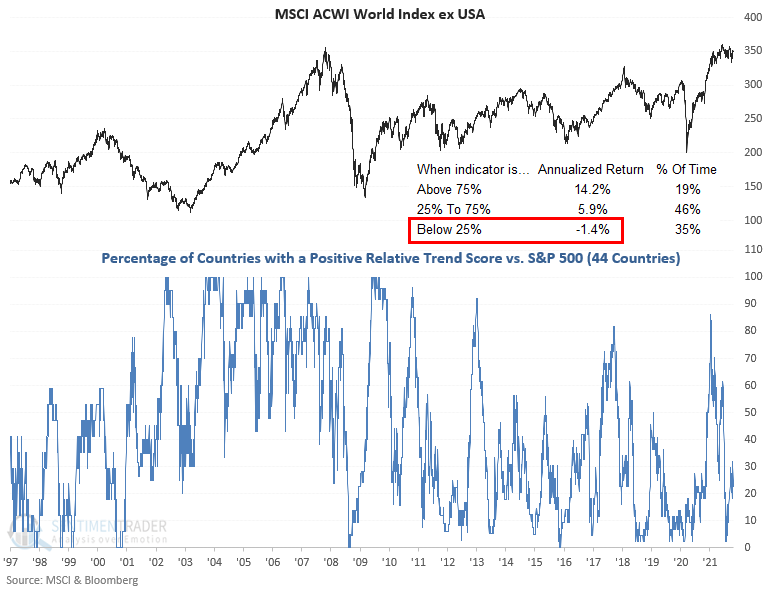
The percentage of countries with a relative trend score of -10 versus the S&P 500 increased slightly on a w/w basis. The Asia Pacific region held steady while Europe deteriorated. If you were wondering about Europe, France and Ireland returned to a relative trend score of -10.
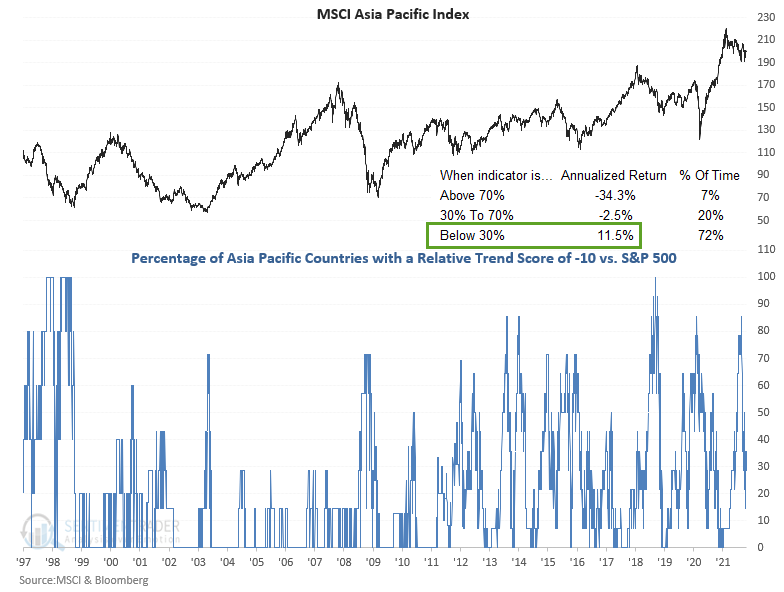
The percentage of countries in the Asia Pacific region with a relative trend score of -10 held steady on a w/w basis. The current level resides just below a more favorable threshold for returns for the MSCI Asia Pacific index.
I think this is a must-watch indicator on a go-forward basis as the supply chain and shipping bottlenecks impact economies around the globe.
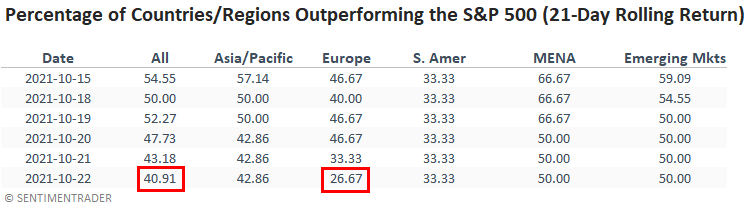
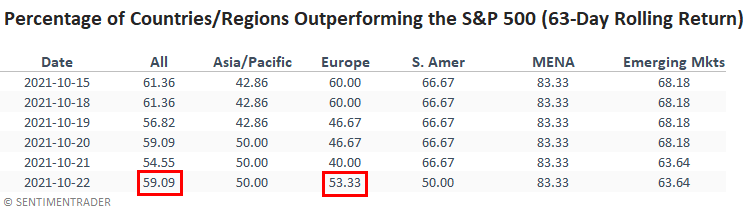
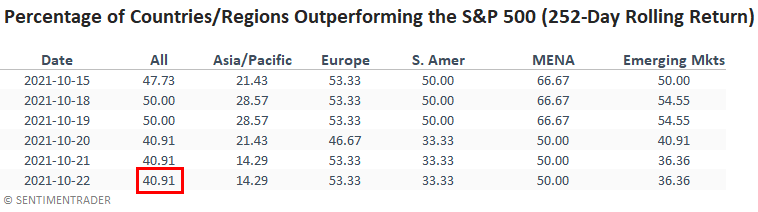
In a note on 7/7/21, I shared a study that assessed the forward return outlook for stocks when the percentage of countries outperforming the S&P 500 on a rolling 21-day basis falls to a low level. I've included a snapshot of the indicator from the original study and two additional tables with different rolling periods.
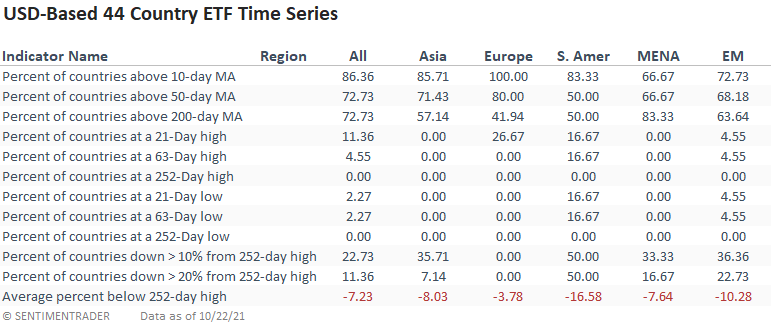
GLOBAL BREADTH
Global participation amongst USD-based country ETFs is improving.
ABSOLUTE AND RELATIVE TREND COLUMN DEFINITIONS
- Absolute Trend Count Score - The absolute trend model contains ten indicators to assess absolute trends across several durations.
- Absolute Trend 5-Day Change - This indicator measures the 5-day net change in the absolute trend model.
- Relative Trend Count Score - The relative trend model contains ten indicators to assess relative trends vs. the S&P across durations.
- Relative Trend 5-Day Change - This indicator measures the 5-day net change in the relative trend model.
- Relative High Count - This indicator measures the number of 21-day relative highs vs. the S&P 500 in the last 5 days.
- Relative Low Count - This indicator measures the number of 21-day relative lows vs. the S&P 500 in the last 5 days.
- Absolute and Relative Trend Scores range from 10 (Best) to -10 (Worst)
- MA Trend Cnt Above - This indicator counts the number of consecutive days above the 10-day moving average.
- MA Trend Cnt Below - This indicator counts the number of consecutive days below the 10-day moving average.
Please click here for a note with details on the construction of the composite trend model.