
Absolute & Relative Trend Update

The goal of today's note is to provide you with some insight into what I am seeing with my absolute and relative trend following indicators for domestic and international ETFs.
Data as of 5/21/21 close. All relative comparisons are versus the S&P 500 ETF (SPY). For absolute and relative indicator definitions, please scroll down to the end of the note.
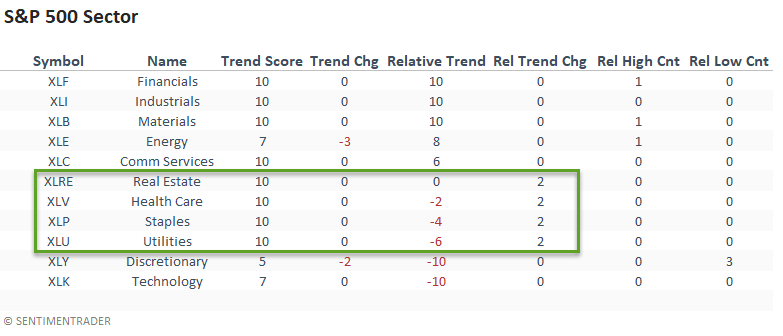
ABSOLUTE & RELATIVE TRENDS - SECTOR ETFS
The market continues to favor a value/cyclical tilt. Interestingly, the relative trend scores for defensive sectors showed a modest w/w increase. Technology and consumer discretionary remain weak, with discretionary registering three new relative lows last week.
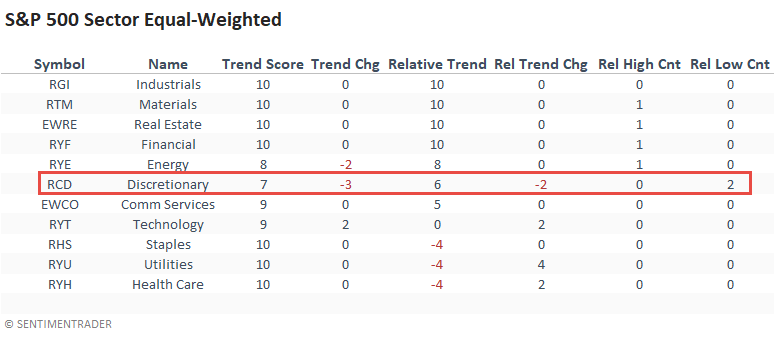
The absolute and relative trend scores for the equal-weighted consumer discretionary sector deteriorated, with the group registering two relative lows last week.
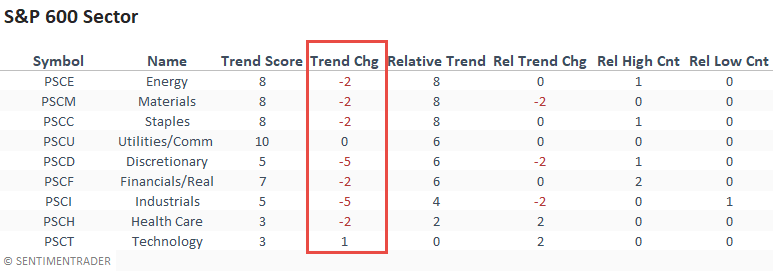
Several small-cap sectors showed a noticeable decline in their respective absolute trend scores. If the small-caps start to exhibit a weak absolute and relative trend profile, one needs to mind the message from this economically sensitive group.
ABSOLUTE & RELATIVE TRENDS - INDUSTRIES
After joining the other value/cyclical groups with a perfect relative trend score in the previous week, the transportation group immediately retreated last week. I would also note the deterioration in the home builder and retail ETFs, two discretionary groups.
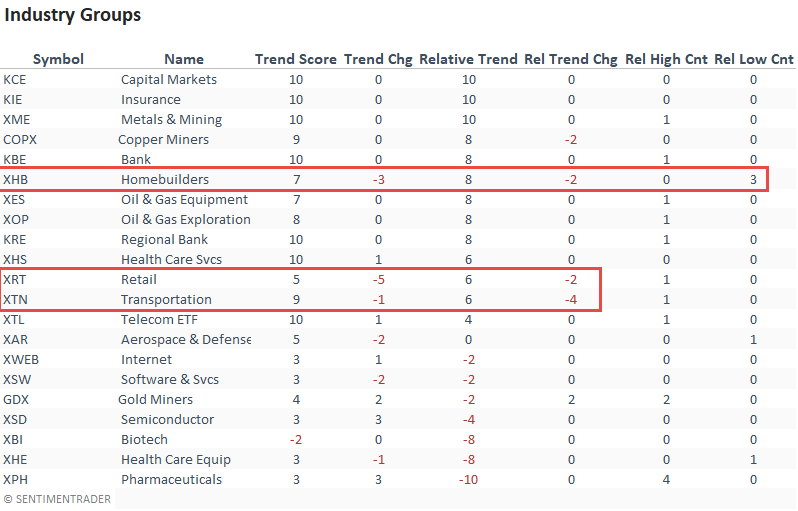
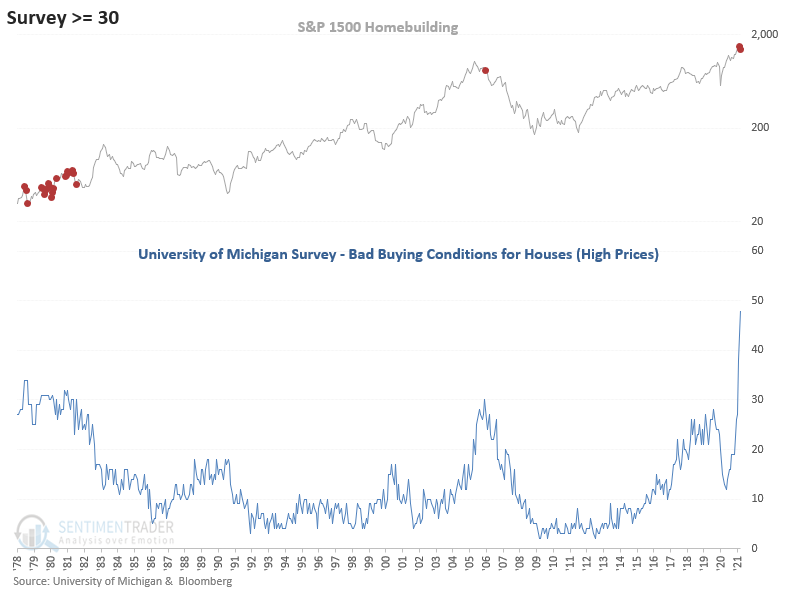
CHART IN FOCUS - Homebuilders
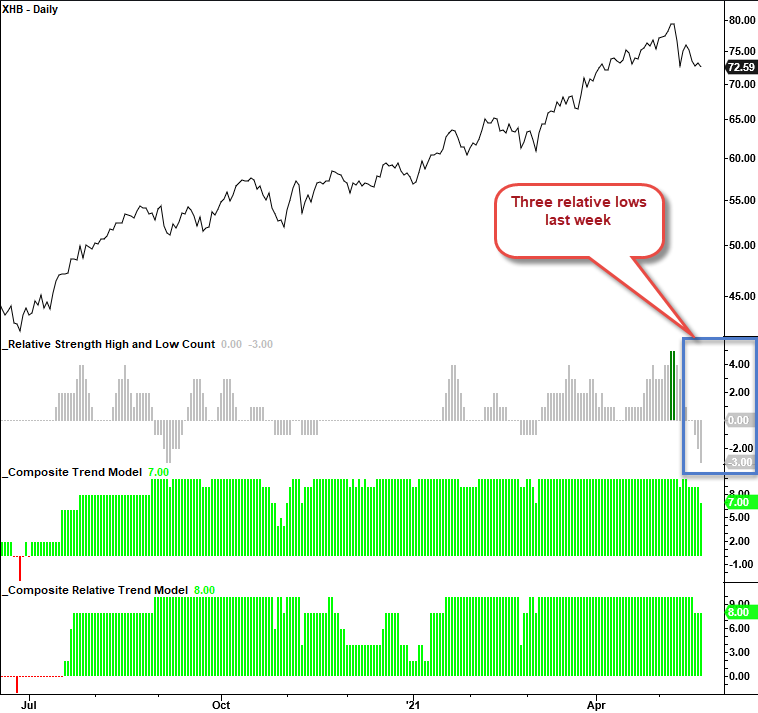
While interest rates remain favorable, I suspect sticker shock could start to weigh on sales.
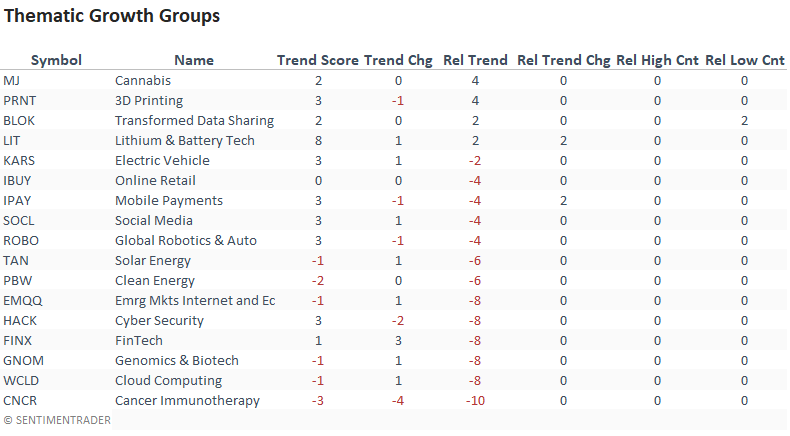
ABSOLUTE & RELATIVE TRENDS - THEMATIC ETFS
Several thematic growth ETFs like EMQQ, BLOK, IBUY, and TAN remain below their respective breakdown pivot points. I would note that relative lows in growth as a whole have become less frequent of late.
ABSOLUTE & RELATIVE TRENDS - COUNTRIES
If I sort the country table by relative trend change, we see notable jumps in Finland, Spain, UAE, and Vietnam. The UK held a relative trend score of 10 for five consecutive days, an achievement not seen since 2012-13. On the opposite end of the spectrum, I would note the decline in Japan. The relative trend score fell to -10.
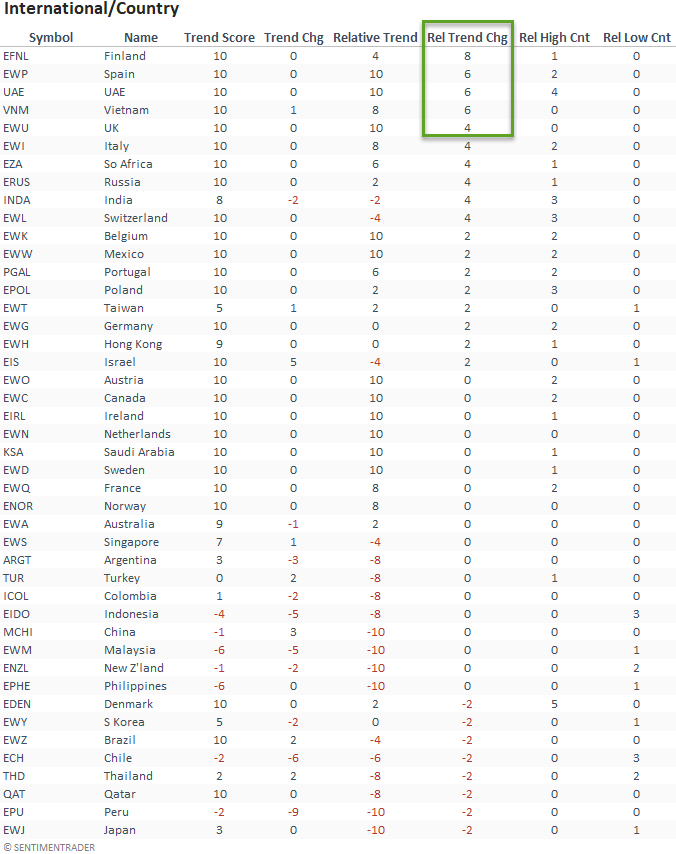
CHART IN FOCUS - EUROPEAN RELATIVE TRENDS
The relative trend score for European countries continues to improve with a w/w/ gain in the percentage of countries outperforming the S&P 500.
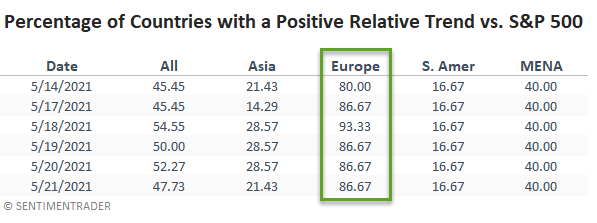
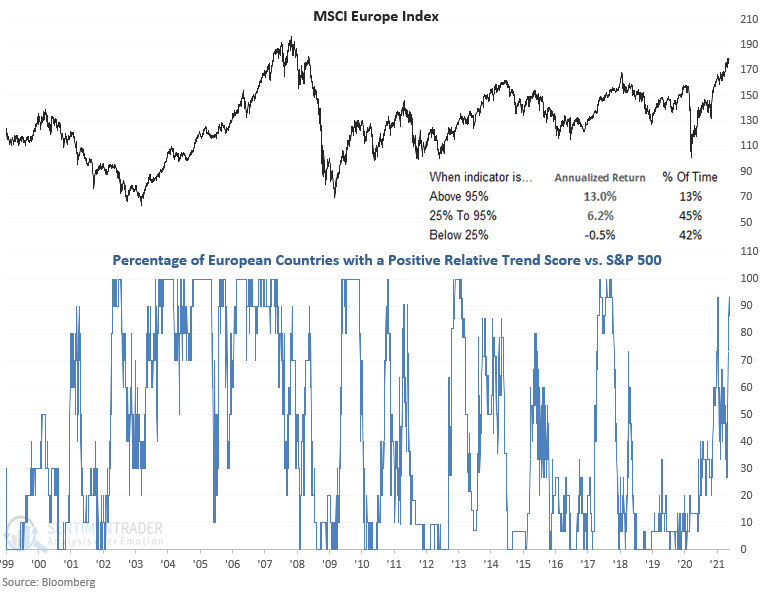
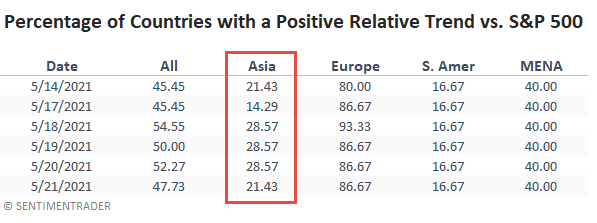
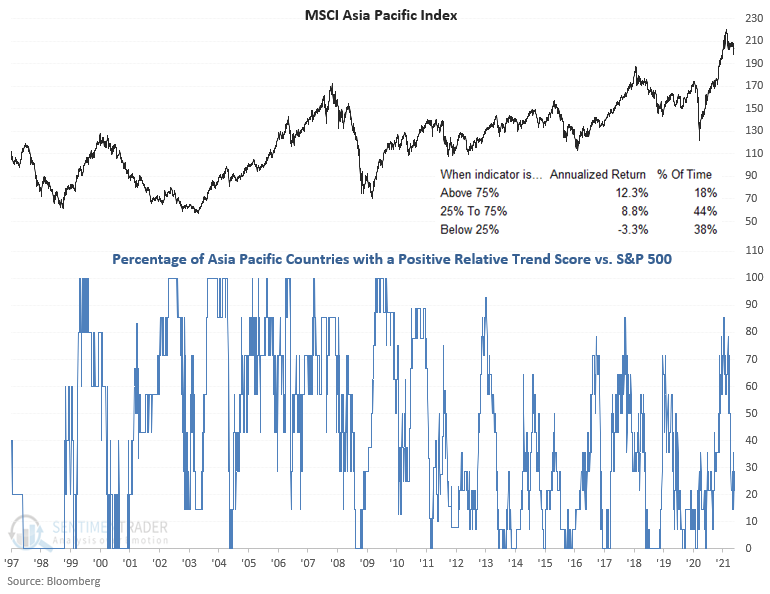
CHART IN FOCUS - ASIA PACIFIC RELATIVE TRENDS
Asia Pacific countries with a positive relative trend score versus the S&P 500 have fallen to an unfavorable level for a broad-based allocation to the region.
ABSOLUTE AND RELATIVE TREND COLUMN DEFINITIONS
- Absolute Trend Count Score - The absolute trend model contains ten indicators to assess absolute trends across several durations.
- Absolute Trend 5-Day Change - This indicator measures the 5-day net change in the absolute trend model.
- Relative Trend Count Score - The relative trend model contains ten indicators to assess relative trends vs. the S&P across durations.
- Relative Trend 5-Day Change - This indicator measures the 5-day net change in the relative trend model.
- Relative High Count - This indicator measures the number of 21-day relative highs vs. the S&P 500 in the last 5 days.
- Relative Low Count - This indicator measures the number of 21-day relative lows vs. the S&P 500 in the last 5 days.
- Absolute and Relative Trend Scores range from 10 (Best) to -10 (Worst)