
Absolute & Relative Trend Update

The goal of today's note is to provide you with some insight into what I am seeing with my absolute and relative trend following indicators for domestic and international ETFs.
Data as of 8/20/21 close. All relative comparisons are versus the S&P 500 ETF (SPY). For absolute and relative indicator definitions, please scroll down to the end of the note.
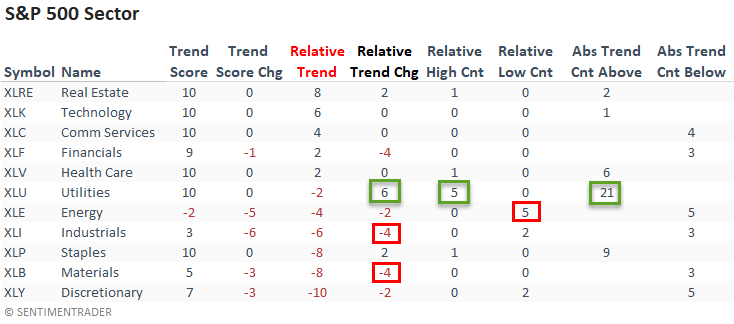
ABSOLUTE & RELATIVE TRENDS - SECTOR ETFS
Last week, the relative trend backdrop turned defensive with relative highs from utilities, staples, health care, and real estate. The utilities led the way with a six-point increase in its relative trend score and a new relative high on all five trading days. I would also note that relative trend scores for the more offensive or cyclical-oriented sectors turned down.
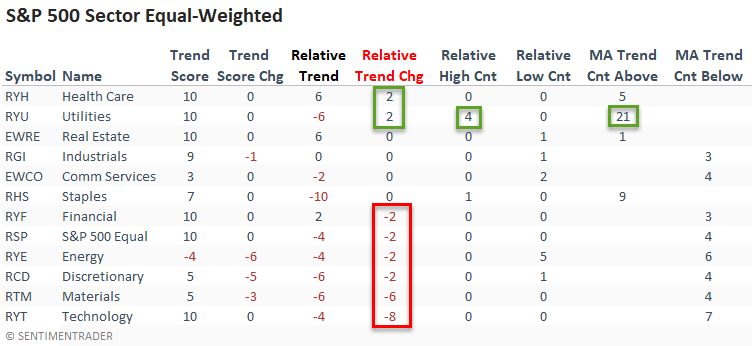
The equal-weighted sectors confirmed the cap-weighted data with a more defensive tone.
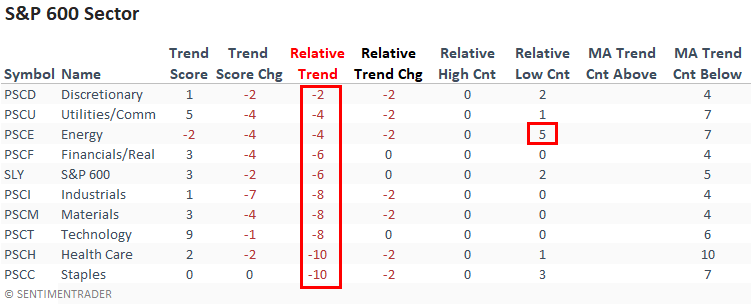
Small-cap sectors now show zero groups with a positive relative trend score versus the S&P 500.
The weight-of-the-evidence continues to suggest that small caps are in the penalty box until further notice.
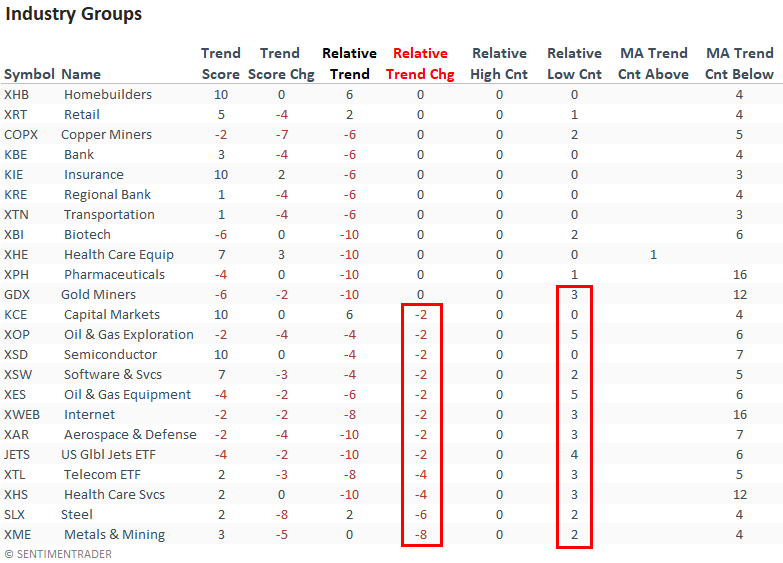
ABSOLUTE & RELATIVE TRENDS - INDUSTRIES
Suppose you sort the industry table according to the relative trend change. In that case, we see that twelve groups registered a decrease in their respective relative trend score with not a single increase from an industry. I would also add that no groups registered a new relative high, whereas several recorded multiple lows.
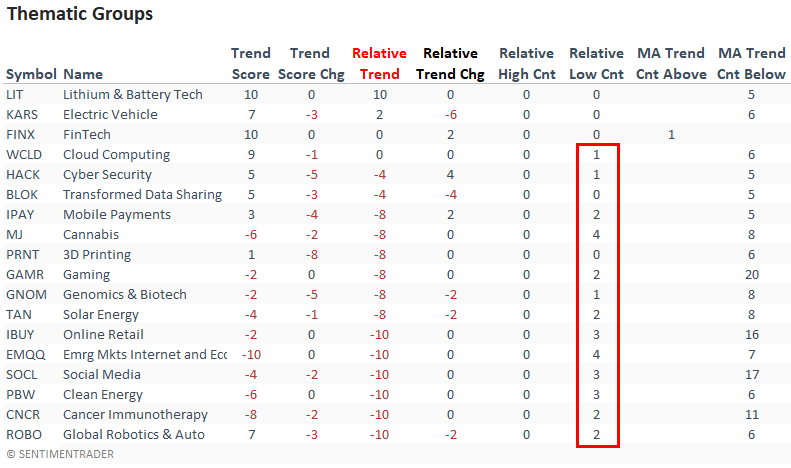
ABSOLUTE & RELATIVE TRENDS - THEMATIC ETFS
The relative trends for thematic groups look troubling except for the Lithium and Battery Technolgy ETF. I would note that the Electric Vehicle ETF had been a standout until last week. Looking at the relative high and low count columns, we see that relative lows are abundant.
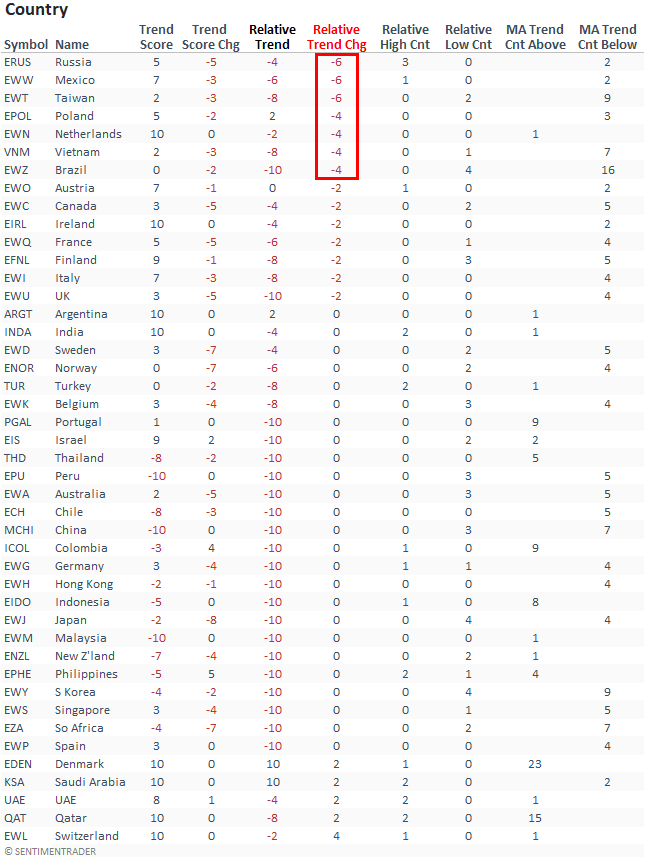
ABSOLUTE & RELATIVE TRENDS - COUNTRIES
Suppose I sort the Country table by the relative trend score change column. In that case, it shows several emerging market countries with a notable decrease in their respective relative trend scores on a w/w basis.
If you had a chance to read my Dollar Index note from Friday, it showed that emerging markets would struggle in a dollar uptrend.
An emerging market country, Brazil saw its relative trend score fall to -10 for the first time since March.
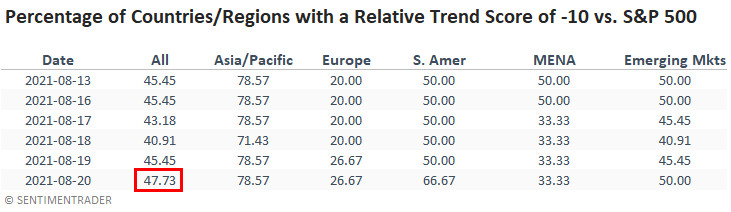
The percentage of countries with a relative trend score of -10 remains at a level that suggests negative forward returns for a broad-based global allocation.
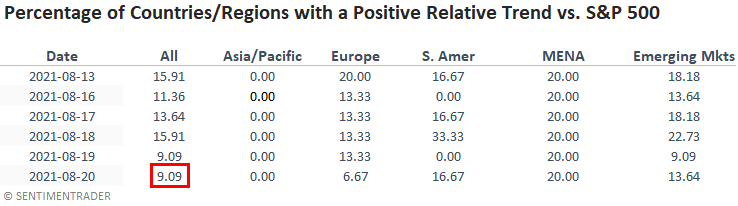
GLOBAL RELATIVE TRENDS
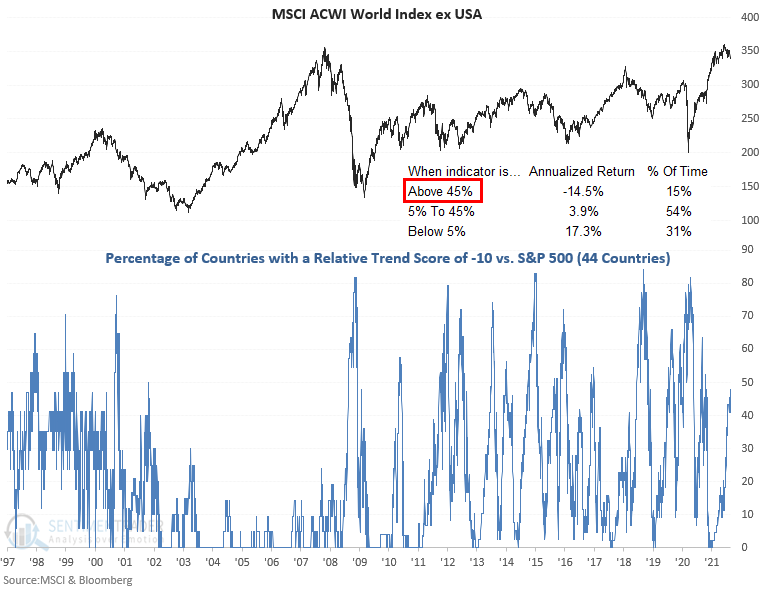
The percentage of countries with a positive relative trend score versus the S&P 500 decreased on a w/w basis. The current level suggests an unfavorable environment for the MSCI ACWI World Index ex USA.
ALL COUNTRY RELATIVE TREND CHART
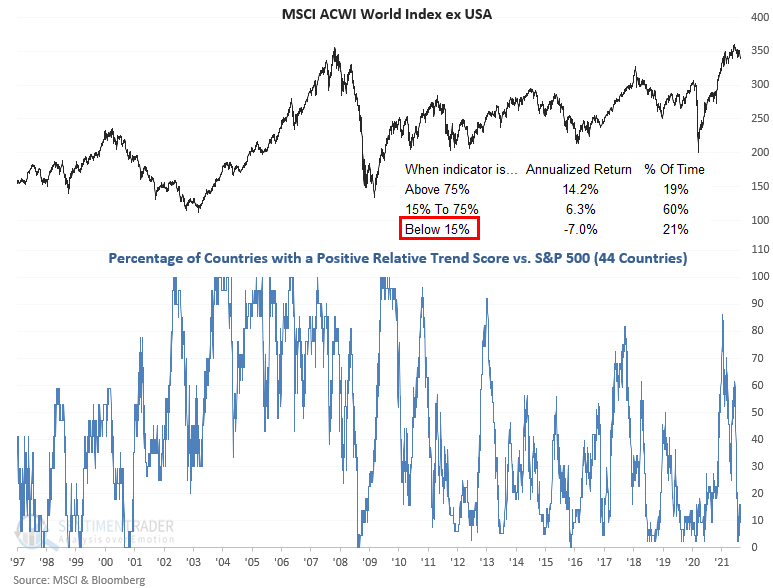
The percentage of countries with a relative trend score of -10 versus the S&P 500 remains at a level that suggests negative returns for the MSCI ACWI World Index ex USA.
The percentage of countries in the Asia Pacific region with a relative trend score of -10 remains at a level that is concerning.
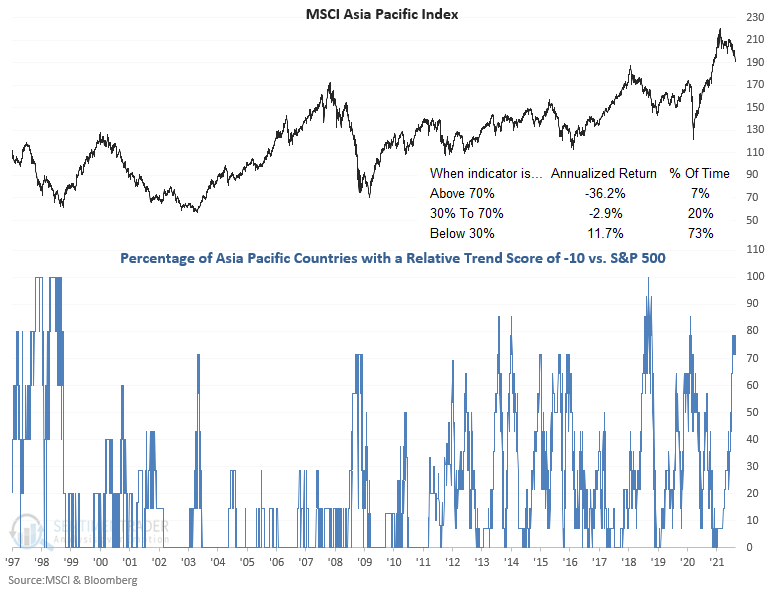
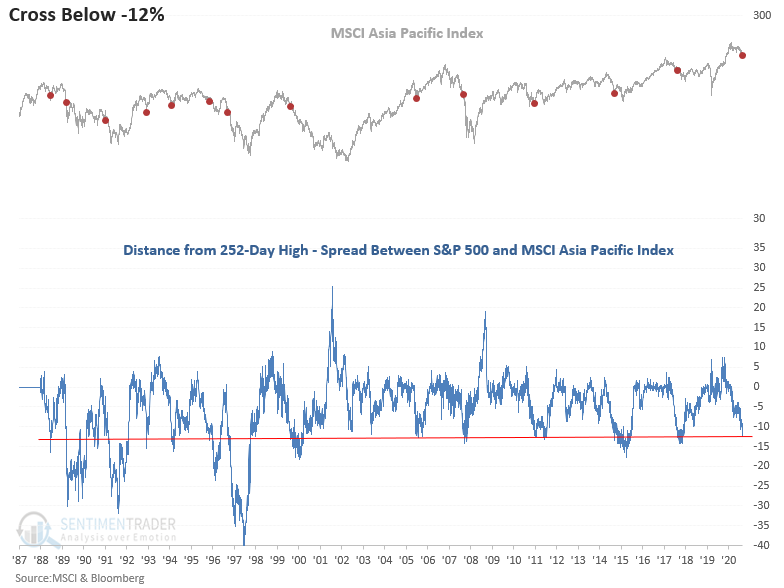
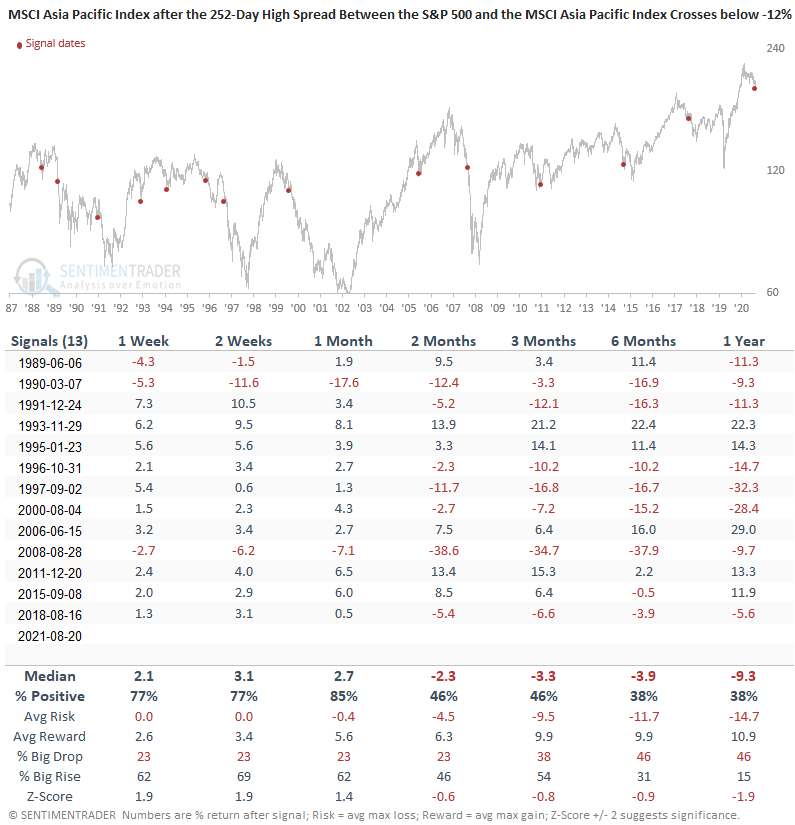
We've noted the weak relative trends for the Asia Pacific region for some time now. The disconnect between the MSCI Asia Pacific Index and the S&P 500 Index caught our eye last week as the divergence has taken a turn for the worse. As of Friday, I show the S&P 500 trading 0.81% below its 252-day high. At the same time, the MSCI Asia Pacific Index is trading 13.45% below its respective 252-day high.
Let's conduct a study to assess the forward return outlook for the MSCI Asia Pacific Index when the distance from the 252-day high spread for the two indexes crosses below -12%.
HISTORICAL CHART
The chart clearly shows that a disconnect between the two indexes typically only occurs in times of market stress for the Asia region.
HOW THE SIGNALS PERFORMED
The short-term returns provide a mean reversion opportunity. However, I would keep a short leash on the idea as the intermediate to long-term performance looks troubling.
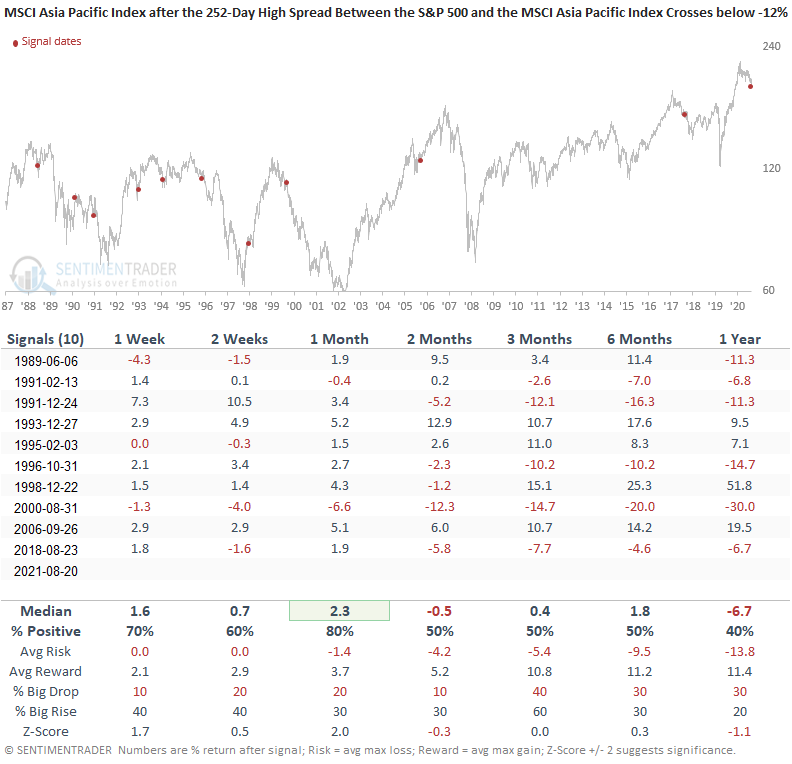
Let's isolate the historical instances some more by requiring that the S&P 500 be down 1% or less from its respective 252-day high when the spread crosses below -12%.
HOW THE SIGNALS PERFORMED
Interestingly, the new condition only eliminated three historical instances. So, that means that it's pretty common to see a disconnect similar to the current scenario. Once again, the study shows a short-term mean reversion opportunity exists. However, keep a short leash.
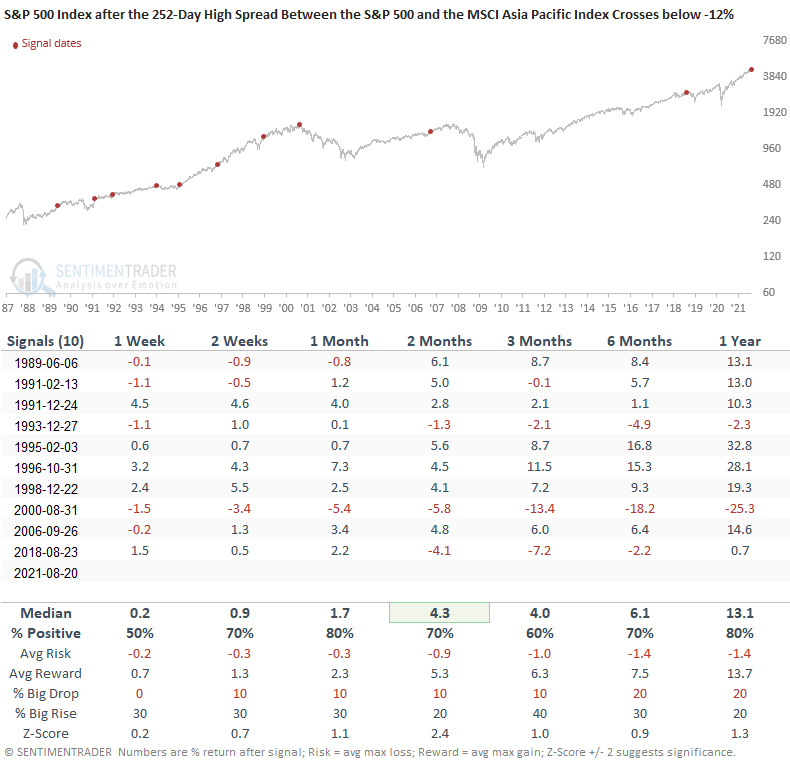
HOW THE SIGNALS PERFORMED - S&P 500 INDEX
Besides a few signals, the disconnect between the Asia Pacific Index and the S&P 500 had little impact on large-cap domestic stocks. Interestingly, the last instance occurred in August 2018. Does history repeat with a 4th quarter correction in the S&P 500?
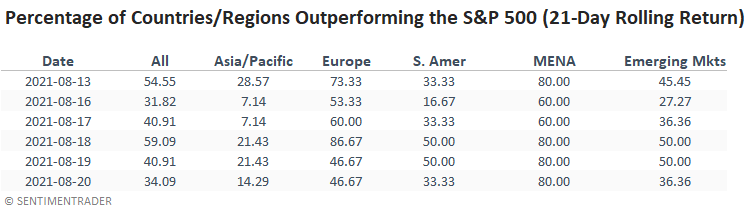
In a note on 7/7/21, I shared a study that assessed the forward return outlook for stocks when the percentage of countries outperforming the S&P 500 on a rolling 21-day basis falls to a low level. Here's a snapshot of the indicator broken down by worldwide regions.
ABSOLUTE AND RELATIVE TREND COLUMN DEFINITIONS
- Absolute Trend Count Score - The absolute trend model contains ten indicators to assess absolute trends across several durations.
- Absolute Trend 5-Day Change - This indicator measures the 5-day net change in the absolute trend model.
- Relative Trend Count Score - The relative trend model contains ten indicators to assess relative trends vs. the S&P across durations.
- Relative Trend 5-Day Change - This indicator measures the 5-day net change in the relative trend model.
- Relative High Count - This indicator measures the number of 21-day relative highs vs. the S&P 500 in the last 5 days.
- Relative Low Count - This indicator measures the number of 21-day relative lows vs. the S&P 500 in the last 5 days.
- Absolute and Relative Trend Scores range from 10 (Best) to -10 (Worst)
- MA Trend Cnt Above - This indicator counts the number of consecutive days above the 10-day moving average.
- MA Trend Cnt Below - This indicator counts the number of consecutive days below the 10-day moving average.