
Absolute & Relative Trend Update

The goal of today's note is to provide you with some insight into what I am seeing with my absolute and relative trend following indicators for domestic and international ETFs.
Data as of 4/30/21 close. All relative comparisons are versus the S&P 500 ETF (SPY). For absolute and relative indicator definitions, please scroll down to the end of the note.
ABSOLUTE & RELATIVE TRENDS
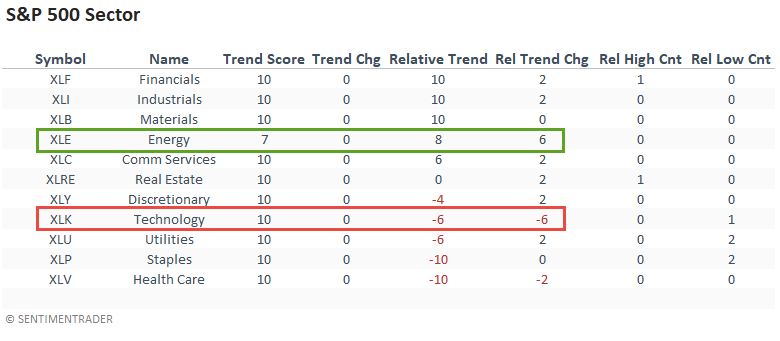
The relative trend scores show a clear bias toward value/cyclical groups. I highlighted the big jump in the energy score as I posted a note last week that reviewed a bullish momentum signal for the group. Technology showed a noticeable decrease in its relative trend score and now maintains the weakest relative profile since February 2019.
HISTORICAL RELATIVE PERFORMANCE
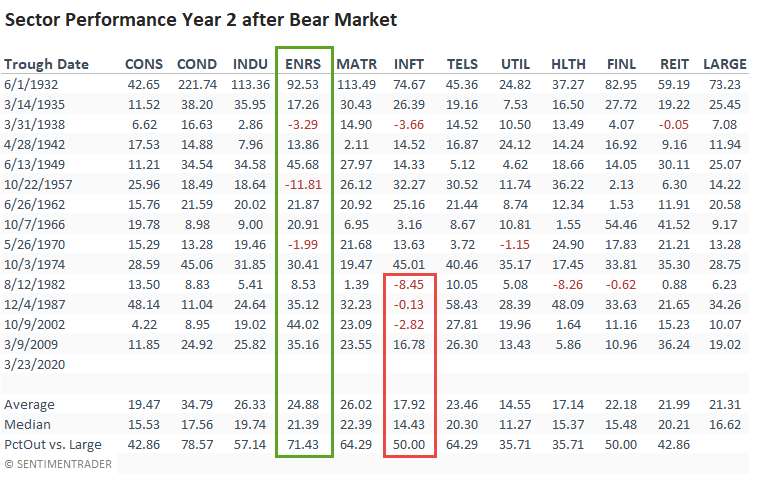
In light of the relative trend score changes for energy and technology, I thought it would be a good idea to look at historical sector performance. As one can see, energy does well, and technology struggles in year two post a bear market bottom. I would add that technology has underperformed in each year since 1982.
ABSOLUTE & RELATIVE TRENDS
The equal-weighted relative trend changes for energy and technology confirm the trends in the cap-weighted data.
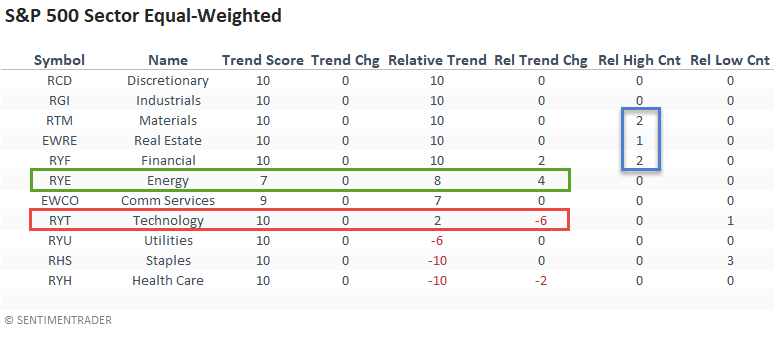
CHART IN FOCUS - CAP AND EQUAL-WEIGHT ENERGY VERSUS TECHNOLOGY
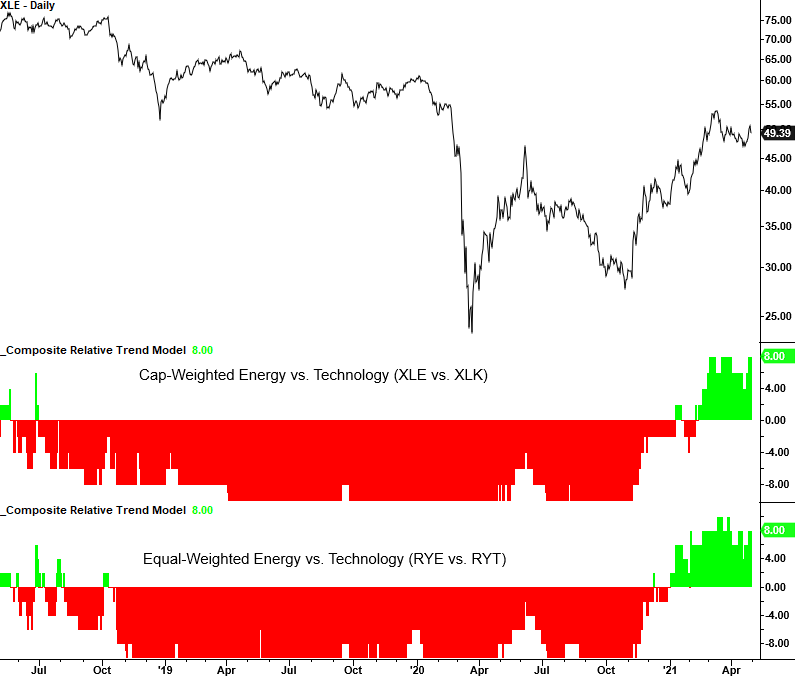
We see a similar relative trend profile for the cap and equal-weighted energy versus technology relative ratio. I always prefer to see confirmation between the two index weighting methodologies as it shows a clear group trend.
ABSOLUTE & RELATIVE TRENDS
Interestingly, the relative profile changes in the large-cap energy and technology sectors did not materialize in the small-cap groups.
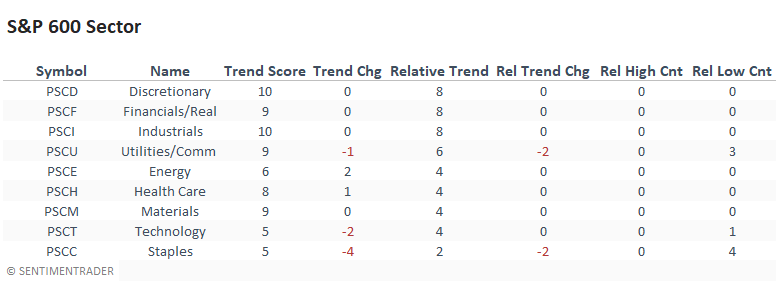
ABSOLUTE & RELATIVE TRENDS
Capital markets, home builders, insurance, and retail maintained their strong relative trend scores and registered several 1-month relative highs last week. The relative trend profiles for semiconductors and gold miners showed further deterioration.
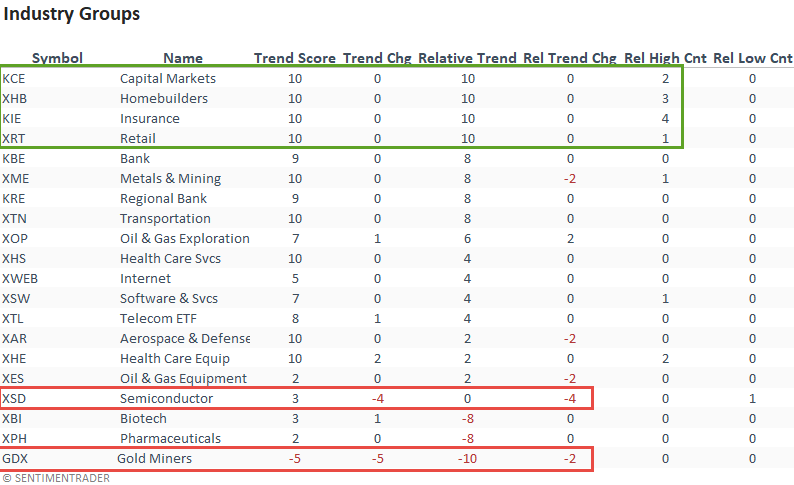
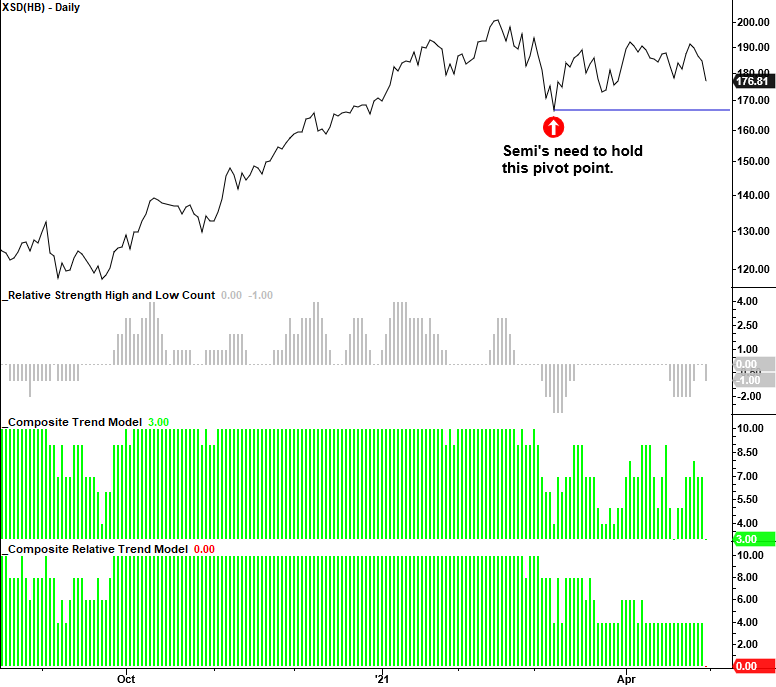
CHART IN FOCUS - SEMICONDUCTORS
ABSOLUTE & RELATIVE TRENDS
The Lithium & Battery Technology group continues to show an improving relative trend profile.

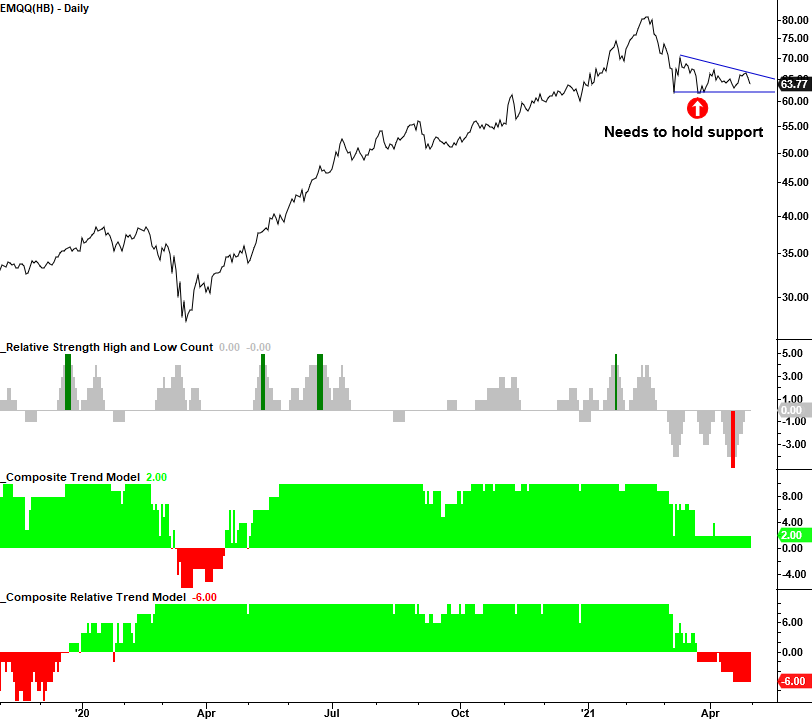
CHART IN FOCUS - EMERGING MARKETS INTERNET & E-COMMERCE
ABSOLUTE & RELATIVE TRENDS
Ireland and Taiwan maintained perfect relative trend scores versus the S&P 500. Many countries showed a meaningful decrease in their scores, especially Vietnam and Chile. The positive relative trend change in Canada is not a surprise given the jump in energy.
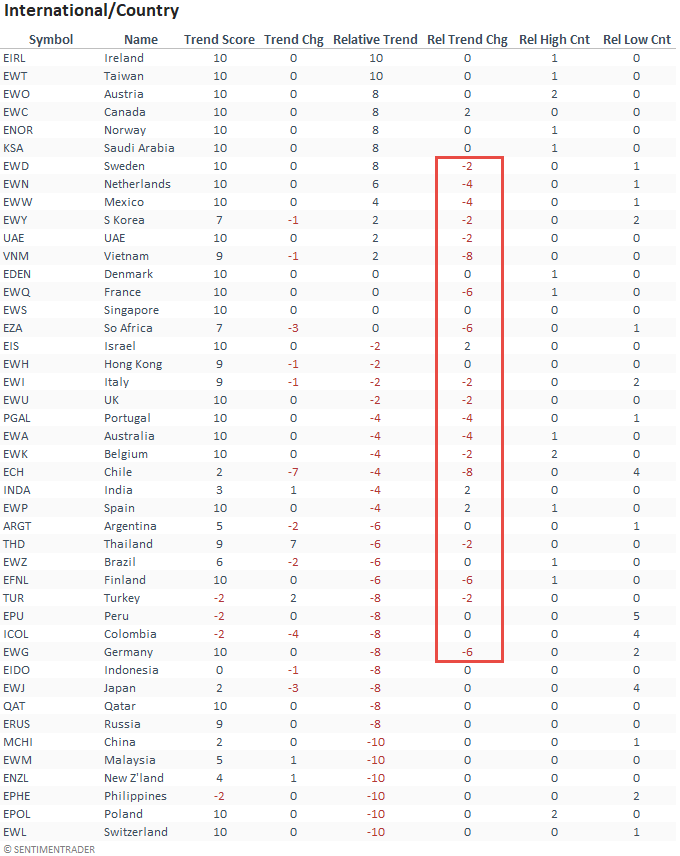
Let's look at a couple of charts that highlight the deterioration in the global relative trend scores.
CHART IN FOCUS - COUNTRY RELATIVE TRENDS
The following chart measures the percentage of countries with a positive relative trend score versus the S&P 500. As one can see, the indicator has fallen by a considerable amount since the peak in January. I would note that the pattern looks similar to other instances since 2010 and nothing like the 2003-2007 timeframe when the global markets outperformed the S&P 500.
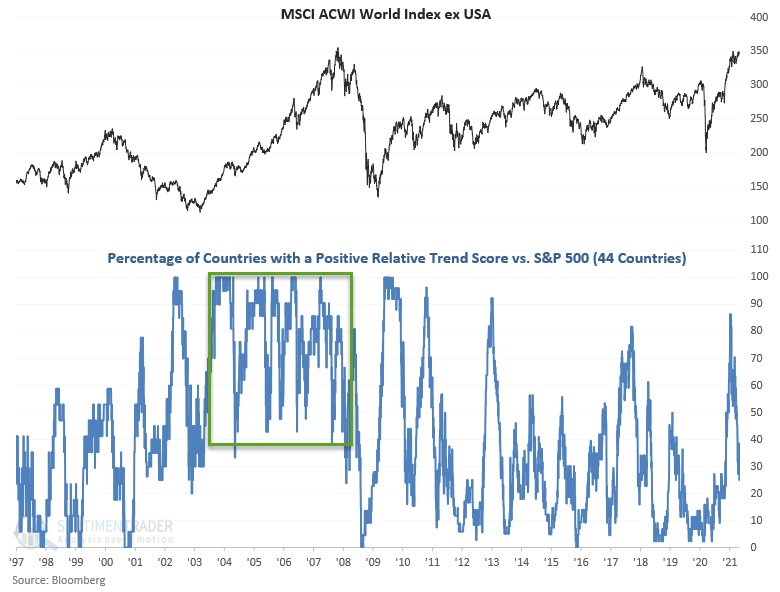
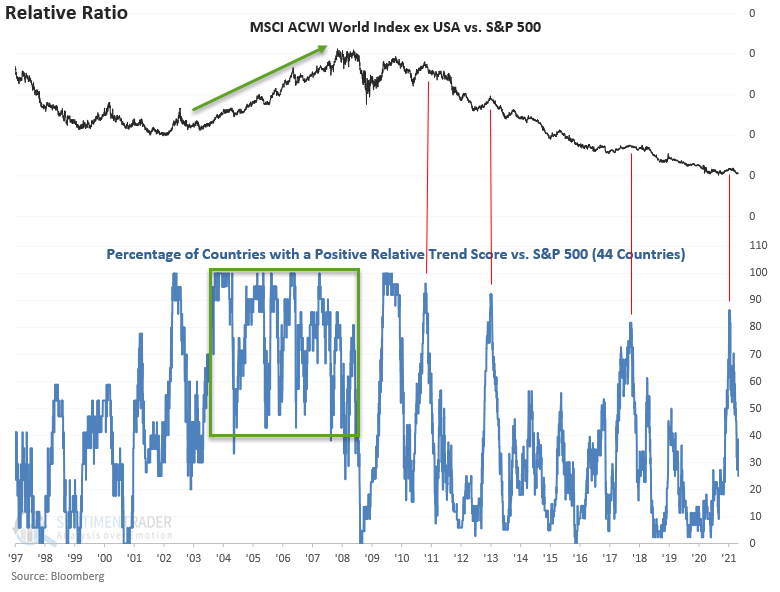
CHART IN FOCUS - COUNTRY RELATIVE TRENDS
Let's look at a relative ratio chart of the MSCI ACWI ex USA Index versus the S&P 500. This chart further highlights why one needs to be careful with a broad-based global allocation. The inability of the indicator to maintain a high level like 2003-2007 is noteworthy.
ABSOLUTE AND RELATIVE TREND COLUMN DEFINITIONS
1.) Absolute Trend Count Score - The absolute trend model contains ten indicators to assess absolute trends across several durations.
2.) Absolute Trend 5-Day Change - This indicator measures the 5-day net change in the absolute trend model.
3.) Relative Trend Count Score - The relative trend model contains ten indicators to assess relative trends across several durations. Relative to S&P 500.
4.) Relative Trend 5-Day Change - This indicator measures the 5-day net change in the relative trend model.
5.) Relative High Count - This indicator measures the number of 21-day relative highs versus the S&P 500 in the last 5 days.
6.) Relative Low Count - This indicator measures the number of 21-day relative lows versus the S&P 500 in the last 5 days.
Absolute and Relative Trend Scores - 10 (Best) to -10 (Worst)