
Absolute & Relative Trend Update

The goal of today's note is to provide you with some insight into what I am seeing with my absolute and relative trend following indicators for domestic and international ETFs.
Data as of 8/13/21 close. All relative comparisons are versus the S&P 500 ETF (SPY). For absolute and relative indicator definitions, please scroll down to the end of the note.
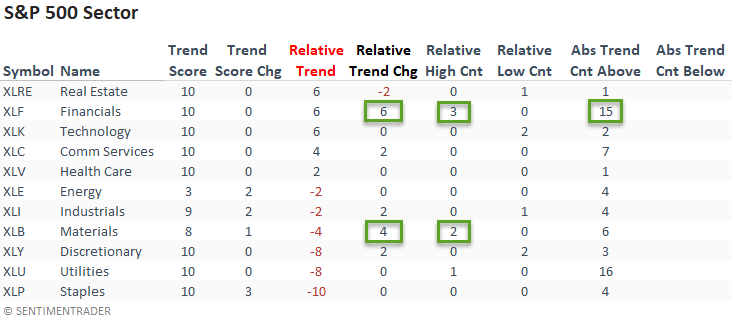
ABSOLUTE & RELATIVE TRENDS - SECTOR ETFS
The relative trend score for the financial sector registered a six-point increase on a w/w basis. And, it recorded a new 1-month relative high on 3/5 days. If we look at short-term price momentum, we see that the sector has traded above its 10-day moving average for 15 consecutive days. In multiple notes last week, I shared several breadth-based momentum studies that suggested financials could see some upside follow-through. Please click here and here. The materials sector, a value/cyclical group, joined the financials with improving relative trends.
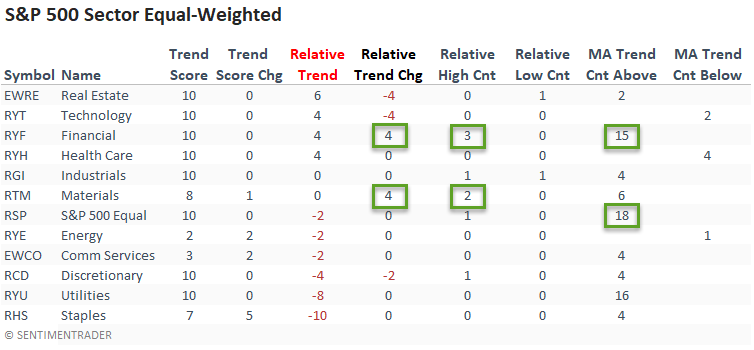
The equal-weighted financial and materials sectors confirmed the improving relative trend profile in the cap-weighted data.
The small-cap financial and materials sectors did not follow the improving relative trends that we noted in the large-cap space. However, the cyclical-oriented industrials sector showed some improvement.
The weight-of-the-evidence continues to suggest that small caps are in the penalty box until further notice.
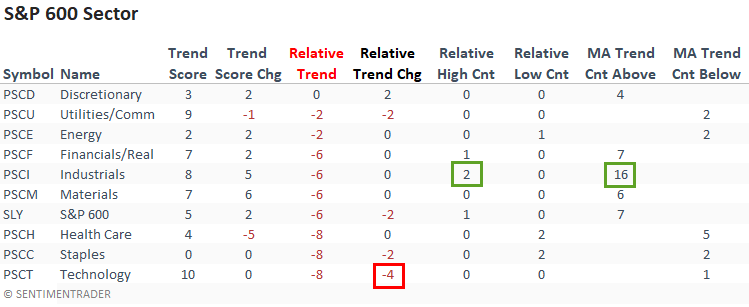
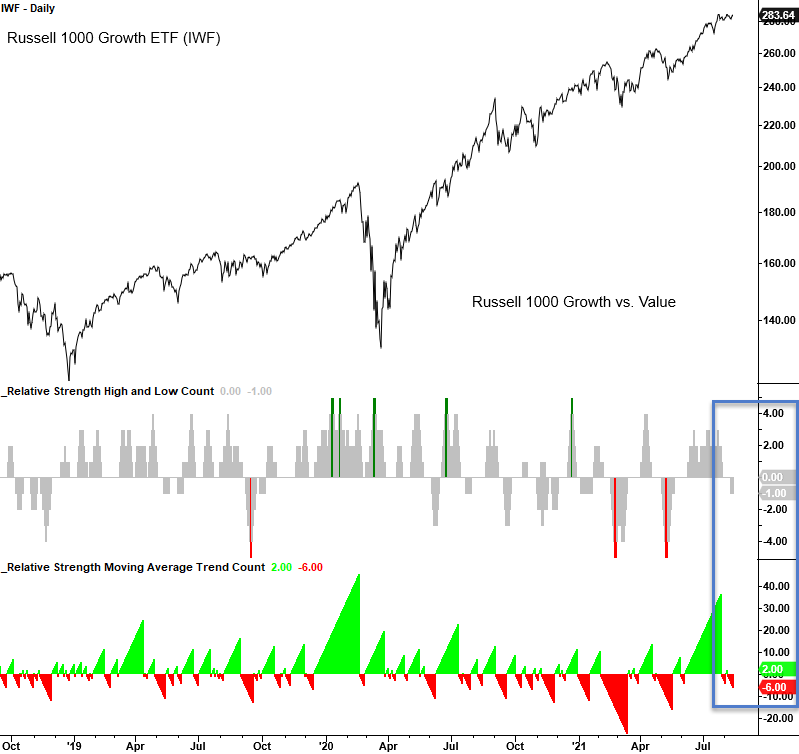
CHART IN FOCUS - GROWTH VS. VALUE
Growth deteriorated ever so slightly last week compared to value with a new 1-month relative low on Thursday. I would also note that the ratio for growth vs. value has now closed below the 10-day moving average for six consecutive days. i.e., value is outperforming on a short-term basis.
ABSOLUTE & RELATIVE TRENDS - INDUSTRIES
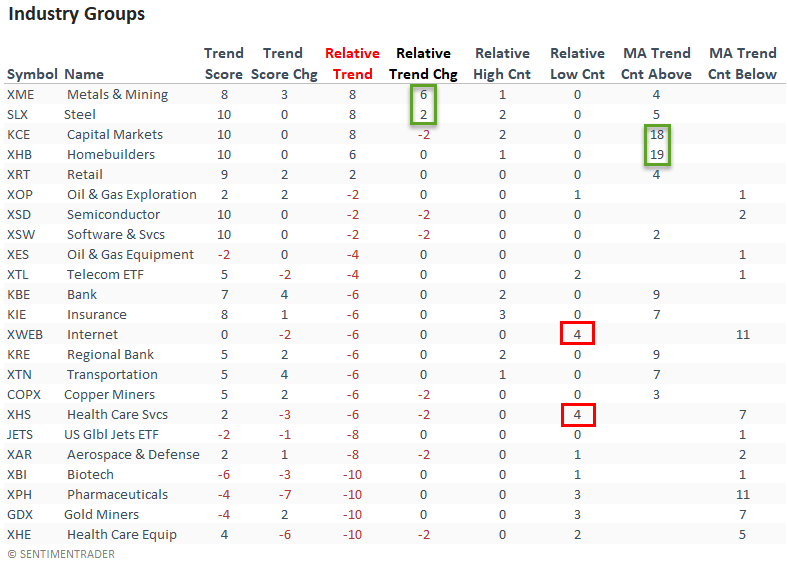
Suppose you sort the industry table according to the relative trend score. In that case, one can see a cyclical tilt with metals and mining, steel, capital markets, and home builders leading the way.
The relative trend profile for the internet group has turned unfavorable.
ABSOLUTE & RELATIVE TRENDS - THEMATIC ETFS
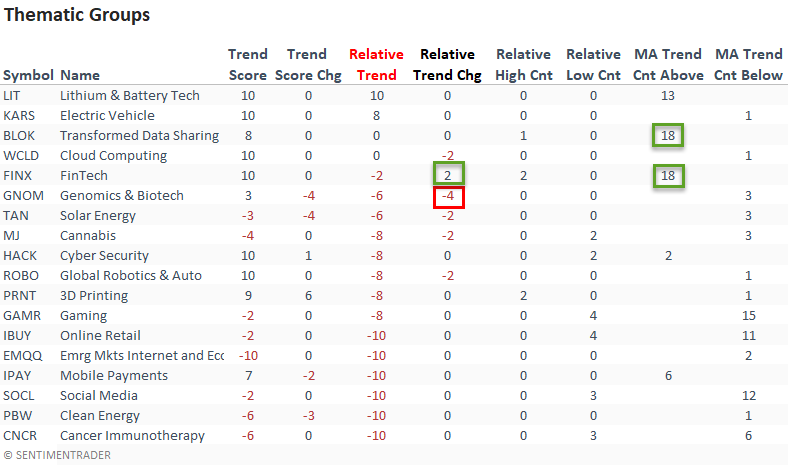
The Lithium and Battery Technology and Electric Vehicle ETFs continue to stand out in the thematic group. The Transformed Data Sharing ETF, a proxy for bitcoin, and the fintech ETF continue to show consistent short-term absolute trends with 18 consecutive days above the 10-day moving average.
ABSOLUTE & RELATIVE TRENDS - COUNTRIES
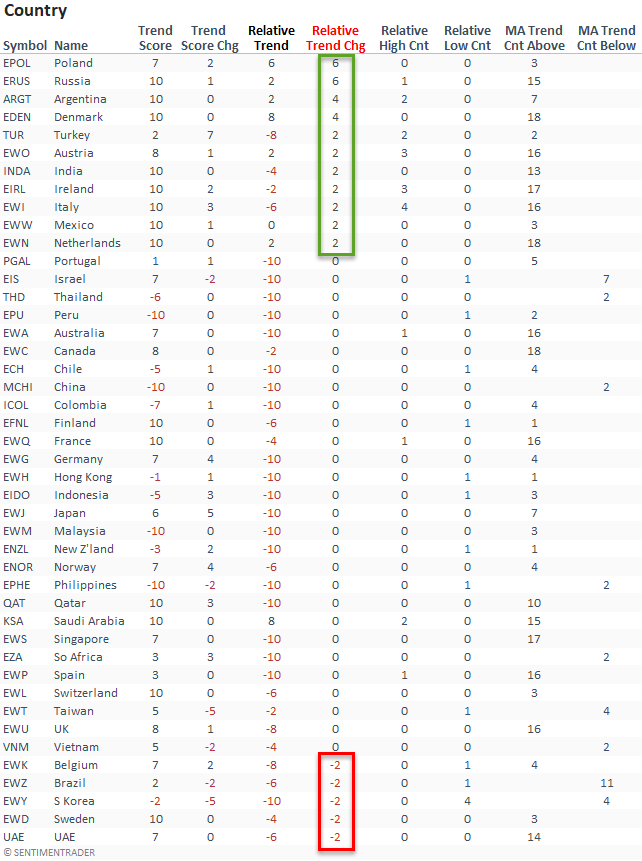
Suppose I sort the Country table by the relative trend score change column. In that case, it shows more countries with an increase in their respective relative trend scores versus a deterioration on a w/w basis. And, the relative trend change reveals a pickup in Eurozone countries.
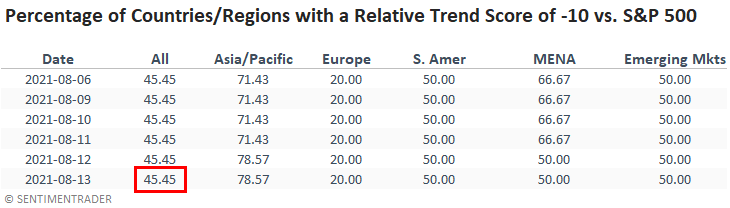
South Korea joined the group of countries with a relative trend score of -10. The Asia Pacific countries, a central manufacturing region, continue to underwhelm on a comparable basis. In some cases, the absolute trends look unfavorable.
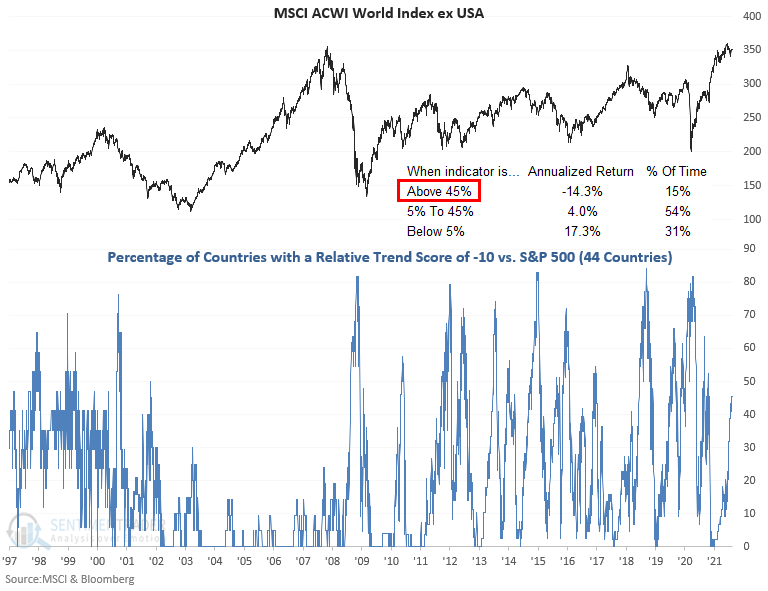
The percentage of countries with a relative trend score of -10 remains at a level that suggests negative forward returns for a broad-based global allocation.
GLOBAL RELATIVE TRENDS
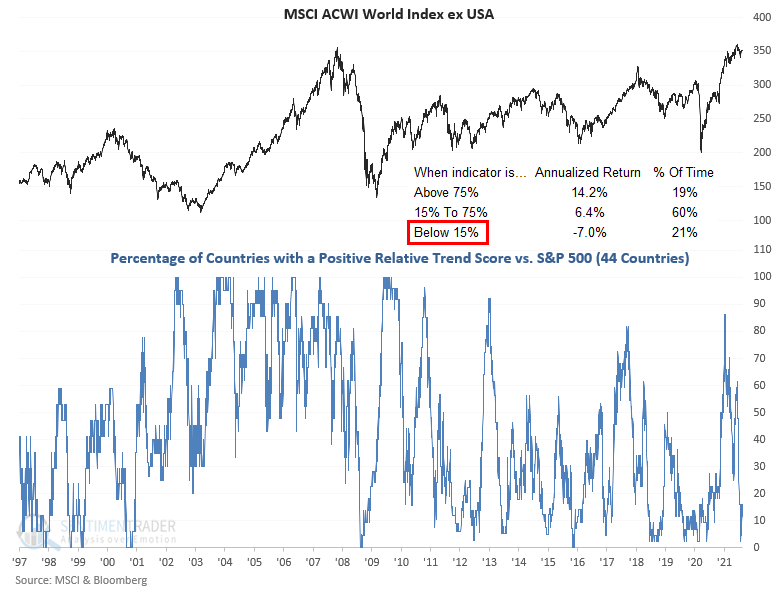
The percentage of countries with a positive relative trend score versus the S&P 500 increased on a w/w basis. However, the current level still suggests an unfavorable environment for the MSCI ACWI World Index ex USA.
ALL COUNTRY RELATIVE TREND CHART
The percentage of countries with a relative trend score of -10 versus the S&P 500 remains at a level that suggests negative returns for the MSCI ACWI World Index ex USA.
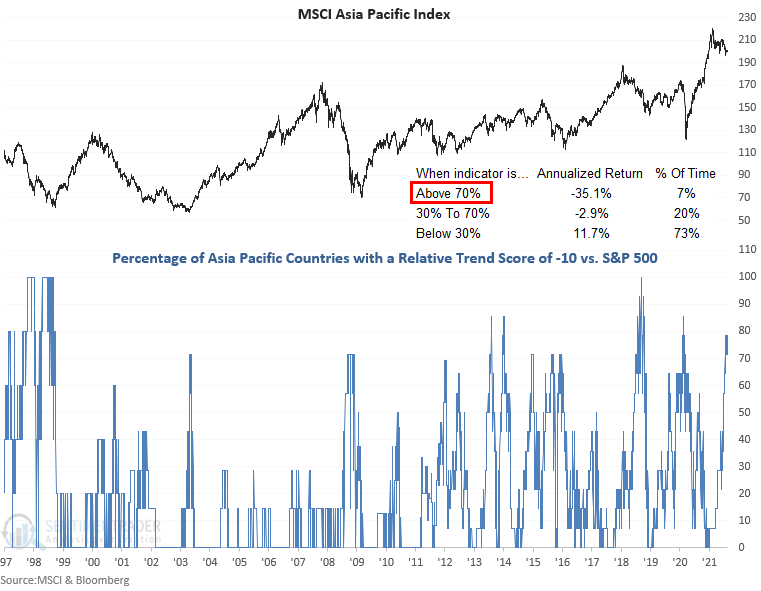
The percentage of countries in the Asia Pacific region with a relative trend score of -10 remains at a level that is concerning.
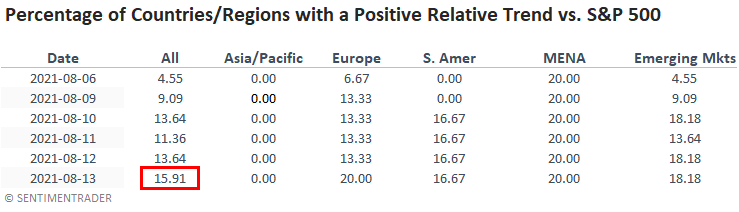
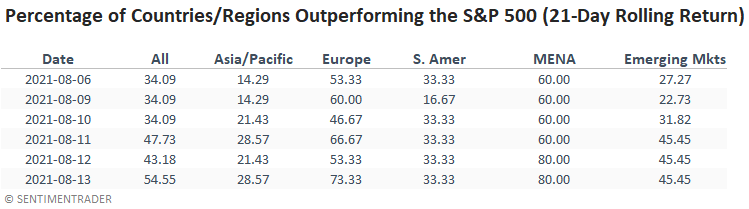
In a note on 7/7/21, I shared a study that assessed the forward return outlook for stocks when the percentage of countries outperforming the S&P 500 on a rolling 21-day basis falls to a low level. Here's a snapshot of the indicator broken down by worldwide regions.
Several regions are showing short-term improvement. I would note that the percentages could diverge from the relative trend values as the calculations use different durations.
ABSOLUTE AND RELATIVE TREND COLUMN DEFINITIONS
- Absolute Trend Count Score - The absolute trend model contains ten indicators to assess absolute trends across several durations.
- Absolute Trend 5-Day Change - This indicator measures the 5-day net change in the absolute trend model.
- Relative Trend Count Score - The relative trend model contains ten indicators to assess relative trends vs. the S&P across durations.
- Relative Trend 5-Day Change - This indicator measures the 5-day net change in the relative trend model.
- Relative High Count - This indicator measures the number of 21-day relative highs vs. the S&P 500 in the last 5 days.
- Relative Low Count - This indicator measures the number of 21-day relative lows vs. the S&P 500 in the last 5 days.
- Absolute and Relative Trend Scores range from 10 (Best) to -10 (Worst)
- MA Trend Cnt Above - This indicator counts the number of consecutive days above the 10-day moving average.
- MA Trend Cnt Below - This indicator counts the number of consecutive days below the 10-day moving average.