Absolute & Relative Trend Update
The goal of today's note is to provide you with some insight into what I am seeing with my absolute and relative trend following indicators for domestic and international ETFs.
Data as of 9/10/21 close. All relative comparisons are versus the S&P 500 ETF (SPY). For absolute and relative indicator definitions, please scroll down to the end of the note.
ABSOLUTE & RELATIVE TRENDS - SECTOR ETFS
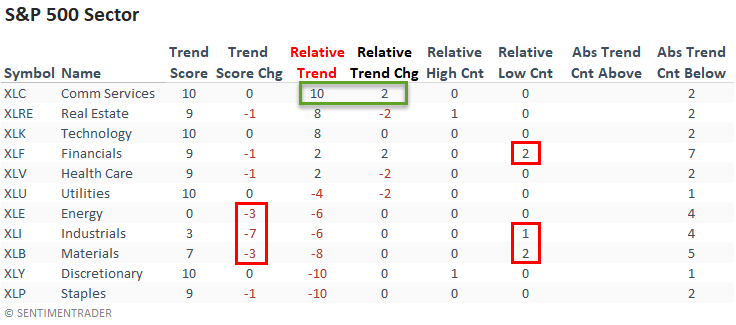
Several cyclical-oriented sectors registered a decline in their respective absolute trend scores, especially the industrials group, which fell seven points. I would also add that most of the same sectors also recorded new relative lows.
Communication services reestablished a perfect trend score combination after a two-point increase in its relative score.

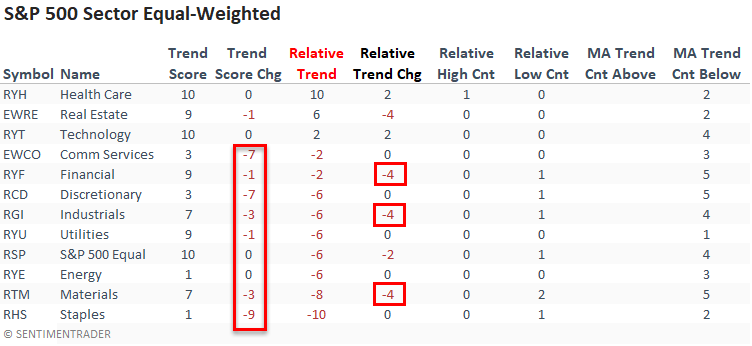
The equal-weighted sector data confirmed the cap-weighted data with a deterioration in the relative scores for several cyclical-oriented groups. I would also add that several sectors registered sizable declines in their absolute trend scores.
Interestingly, the communication services sector registered a noticeable decline in its absolute trend score, highlighting how a few mega-cap issues can significantly differentiate the trend scores when comparing an equal versus a cap-weighted index.
Similar to the large-cap equal-weighted data, small-cap sectors registered several noticeable declines in their respective absolute trend scores. And, I would add that small-caps continue to show zero groups with a positive relative trend score versus the S&P 500.
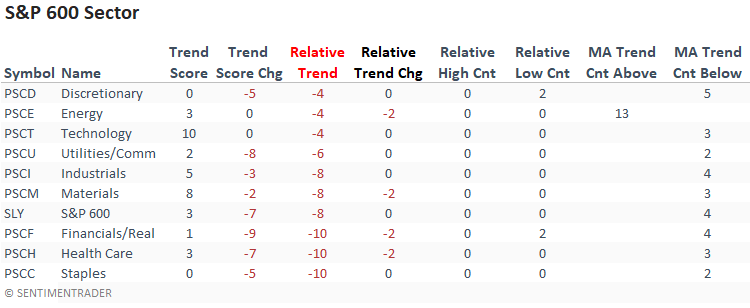
CHART IN FOCUS
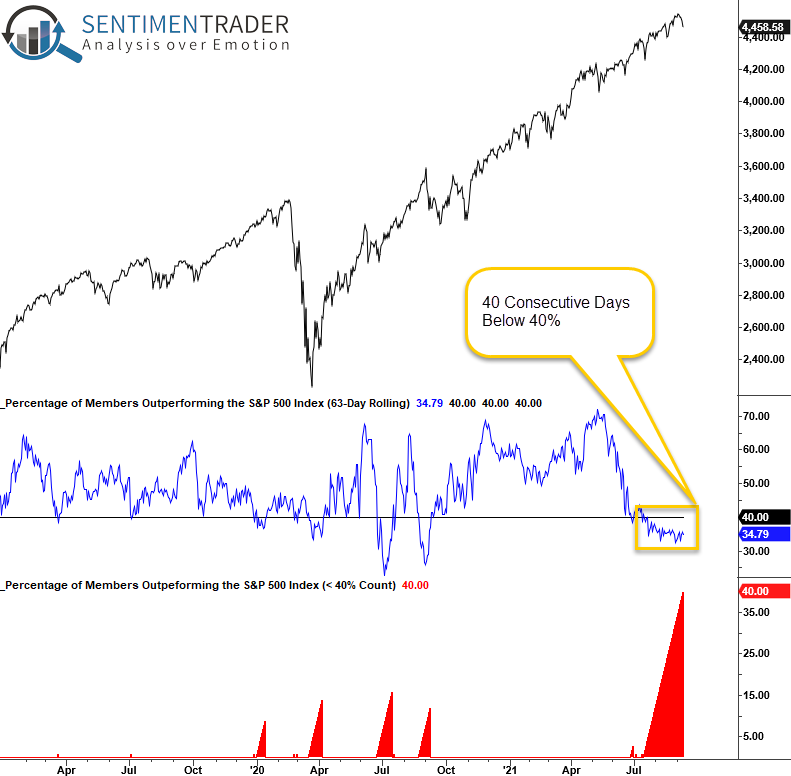
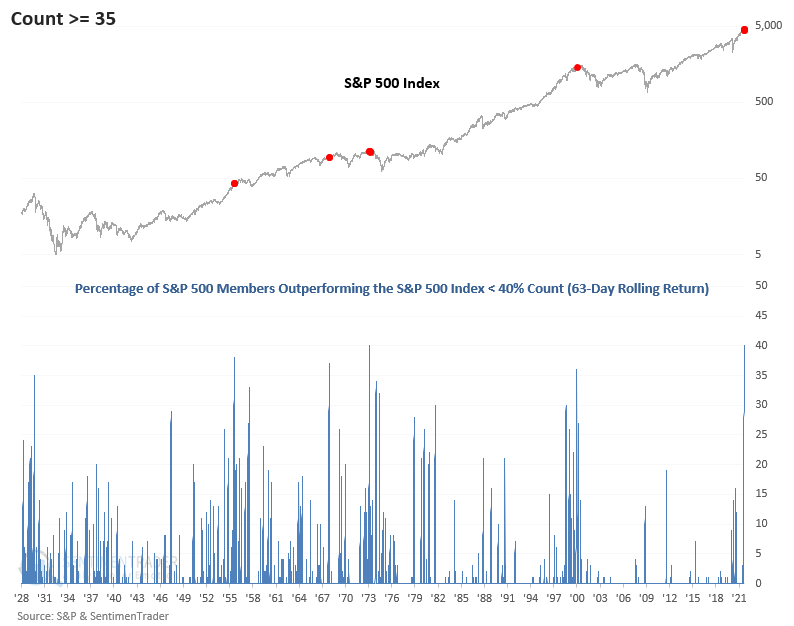
The following chart contains the percentage of S&P 500 members outperforming the S&P 500 index over a rolling 63-day period and an indicator that counts the consecutive number of days below 40% for the outperforming time series.
Over the last 40 days or almost two months, more than 60% of S&P 500 members have underperformed the index, which indicates a lack of participation from the average stock.
Let's zoom out to see how the current environment compares to history. The chart shows that it has matched the highest count in history, which previously occurred on 2/26/1973.
The current market environment is highly unusual and only matched by a few other periods in history. Typically, historical instances of this nature have only occurred near market peaks when breadth was extremely narrow.
The pandemic-driven On vs. Off rotation between growth and value sectors has made the investing environment challenging in year two of the recovery as rolling internal corrections are the norm.
ABSOLUTE & RELATIVE TRENDS - INDUSTRIES
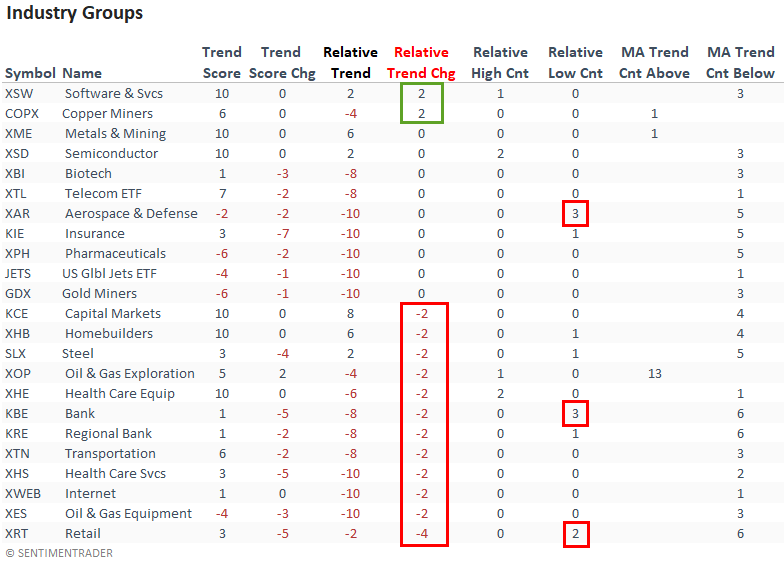
Suppose you sort the industry table according to the relative trend change. In that case, we see more industries with a deterioration in their respective trend score versus an improvement. And, the breakdown showed a tilt toward more cyclical-oriented groups.
ABSOLUTE & RELATIVE TRENDS - THEMATIC ETFS
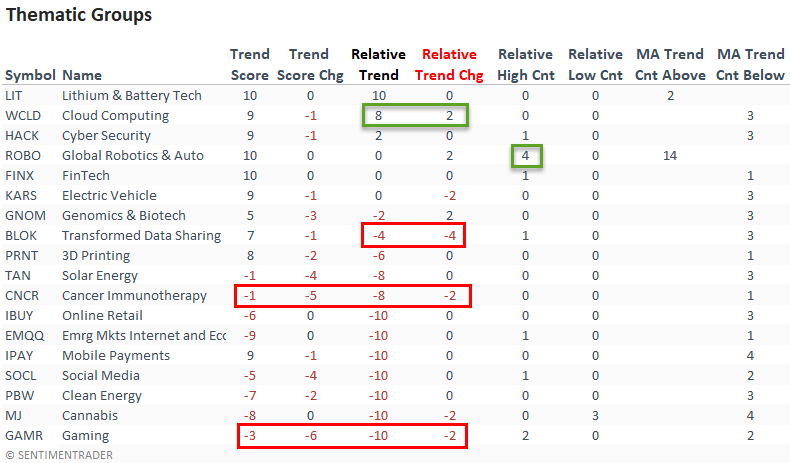
Suppose you sort the thematic ETF table according to the relative trend. In that case, we see only three groups with a positive relative trend score. I would also note the deterioration in the absolute trend score for several groups.
The cloud computing ETF continues to improve and the global robotics and automation ETF registered a new relative high on 4/5 days.
ABSOLUTE & RELATIVE TRENDS - COUNTRIES
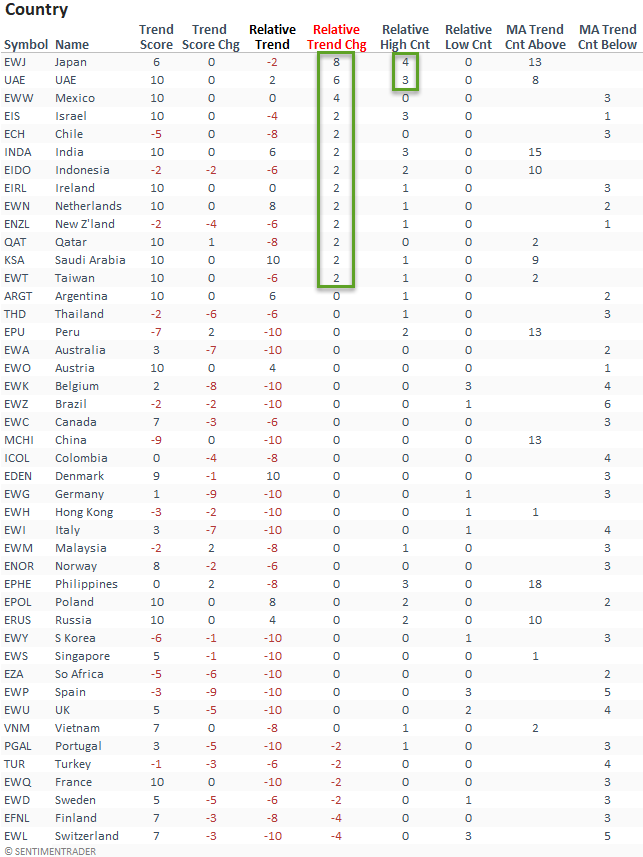
Suppose I sort the Country table by the relative trend score change column. In that case, it shows several countries with an improvement in relative scores versus a deterioration.
Japan recorded a noticeable jump in its relative trend score. We highlighted the momentum surge in the Nikkei 225 Index in two notes last week. Please click here and here.
India, an emerging market country continues to improve.
GLOBAL RELATIVE TRENDS
The percentage of countries with a positive relative trend score versus the S&P 500 improved slightly on a w/w basis. The current level, while improving, continues to suggest an unfavorable environment for the MSCI ACWI World Index ex USA.

ALL COUNTRY RELATIVE TREND CHART
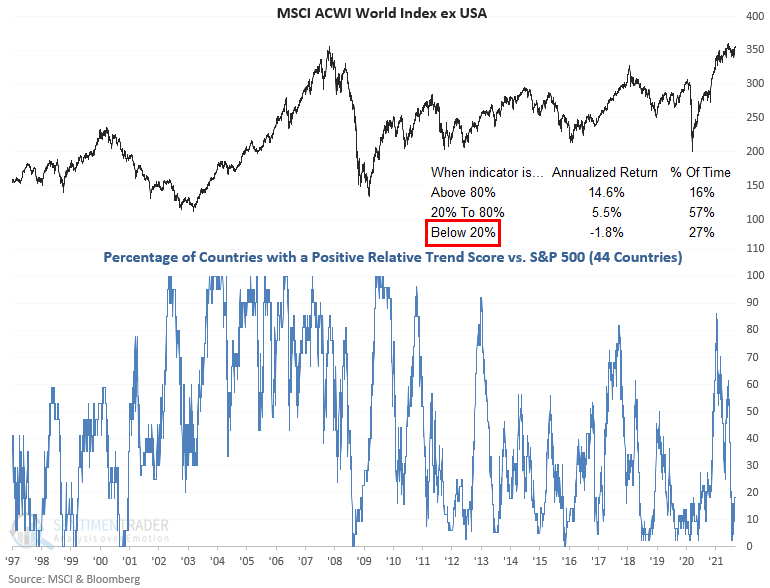
The percentage of countries with a relative trend score of -10 versus the S&P 500 increased slightly on a w/w basis. However, European countries showed a more noticeable jump.

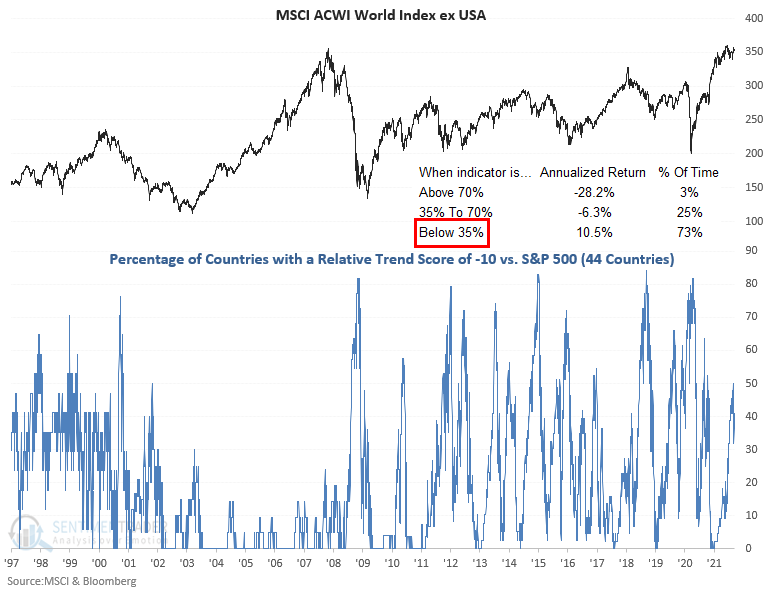
The percentage of countries in Europe with a relative trend score of -10 increased to the highest level since October 2020. Forward returns turn negative when it reaches 75%.
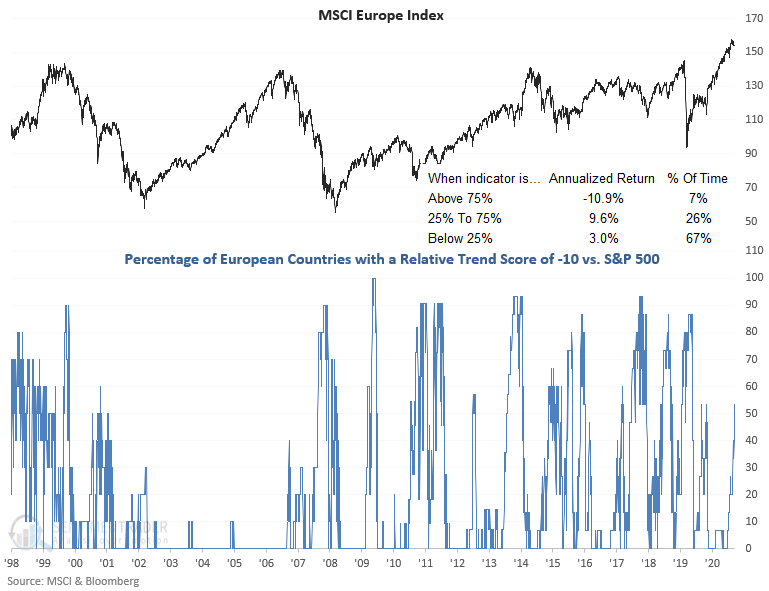
The percentage of countries in the Asia Pacific region with a relative trend score of -10 stabilized at a lower level last week after a sharp decline in the previous week.
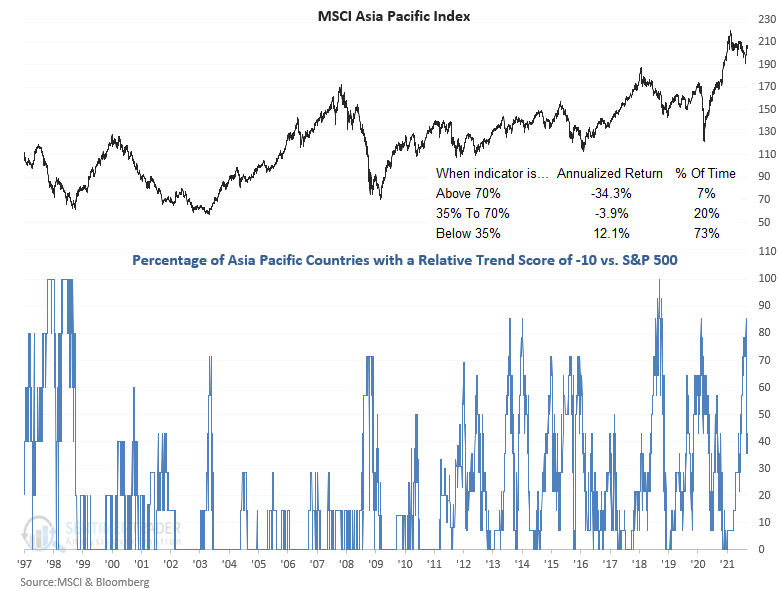
In a note on 7/7/21, I shared a study that assessed the forward return outlook for stocks when the percentage of countries outperforming the S&P 500 on a rolling 21-day basis falls to a low level. Here's a snapshot of the indicator broken down by worldwide regions.
I would note the decline in Europe and the jump in emerging markets.

ABSOLUTE AND RELATIVE TREND COLUMN DEFINITIONS
- Absolute Trend Count Score - The absolute trend model contains ten indicators to assess absolute trends across several durations.
- Absolute Trend 5-Day Change - This indicator measures the 5-day net change in the absolute trend model.
- Relative Trend Count Score - The relative trend model contains ten indicators to assess relative trends vs. the S&P across durations.
- Relative Trend 5-Day Change - This indicator measures the 5-day net change in the relative trend model.
- Relative High Count - This indicator measures the number of 21-day relative highs vs. the S&P 500 in the last 5 days.
- Relative Low Count - This indicator measures the number of 21-day relative lows vs. the S&P 500 in the last 5 days.
- Absolute and Relative Trend Scores range from 10 (Best) to -10 (Worst)
- MA Trend Cnt Above - This indicator counts the number of consecutive days above the 10-day moving average.
- MA Trend Cnt Below - This indicator counts the number of consecutive days below the 10-day moving average.

