
Absolute & Relative Trend Update

The goal of today's note is to provide you with some insight into what I am seeing with my absolute and relative trend following indicators for domestic and international ETFs.
Data as of 7/30/21 close. All relative comparisons are versus the S&P 500 ETF (SPY). For absolute and relative indicator definitions, please scroll down to the end of the note.
ABSOLUTE & RELATIVE TRENDS - SECTOR ETFS
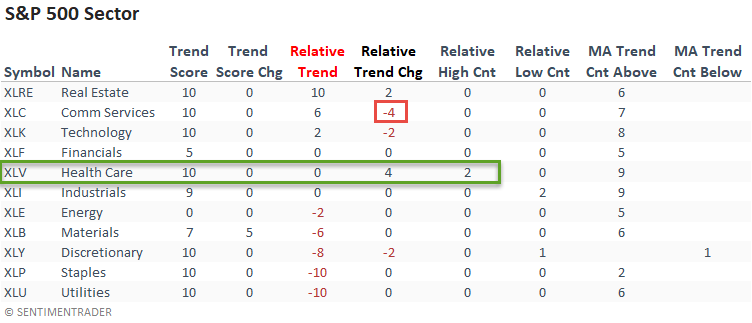
The relative trend score for the traditionally defensive health care sector had a solid w/w change, and it was the only group to register a relative high. The communications sector lost its perfect trend status as it lost ground on a relative basis.
Real Estate continues to look good.
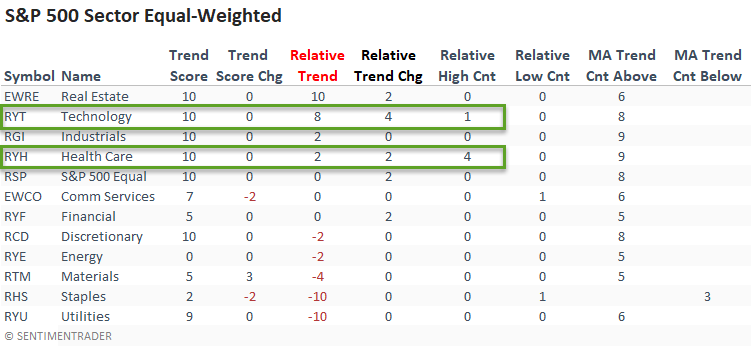
The relative trend score for the equal-weighted technology sector showed an increase of four points on a w/w basis. In contrast, the cap-weighted version was unchanged. Before last week, mega-cap issues had been driving index performance. The change is noteworthy as I always prefer to see the troops leading a group versus just a few generals.
I would note that the equal-weighted health care sector registered a new relative high on 4/5 days.
The 10-day moving average trend count shows that all but one sector showed a pickup in short-term price momentum. However, the strength wasn't enough to move the relative performance needle as most trend scores remained unchanged on the week. Besides a notable jump in technology, most sectors registered a decline in their respective absolute trend scores.
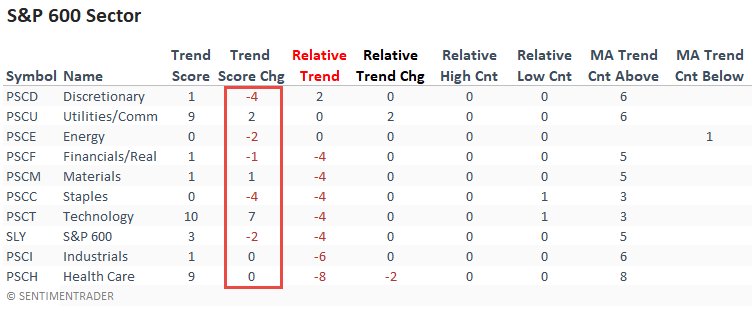
The weight-of-the-evidence continues to suggest that small caps are in the penalty box until further notice.
ABSOLUTE & RELATIVE TRENDS - INDUSTRIES
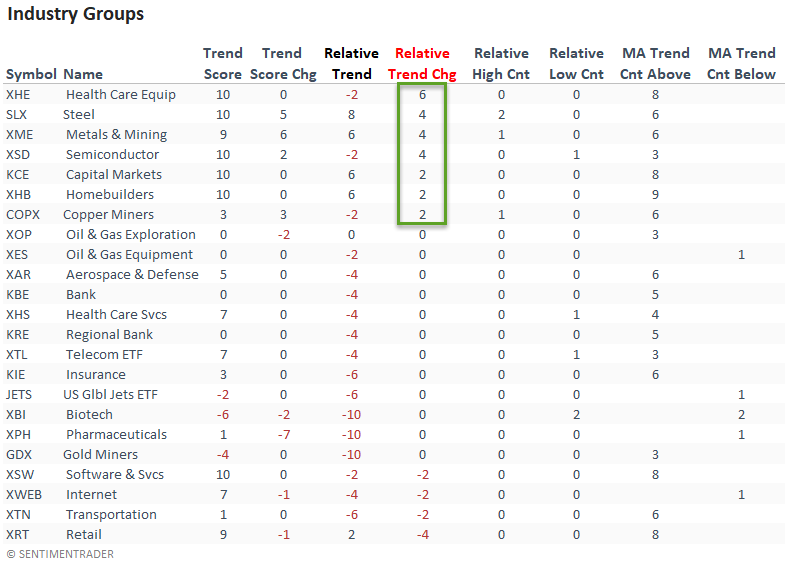
The health care equipment industry registered a significant w/w increase in its relative trend score. I suspect the group played a role in the overall improvement within the health care sector as other groups like Biotech and Pharmaceuticals remained unchanged.
Suppose we analyze the other industries with a positive w/w relative trend score change. In that case, it clearly shows a tilt toward cyclical groups.
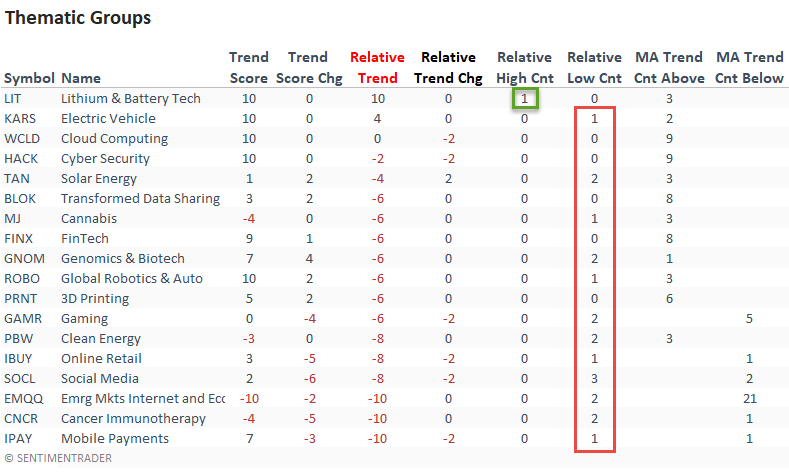
ABSOLUTE & RELATIVE TRENDS - THEMATIC ETFS
Most thematic groups look unattractive, with several ETFs registering new relative lows. However, the Lithium and Battery Technology ETF stands out with a perfect absolute and relative trend score.
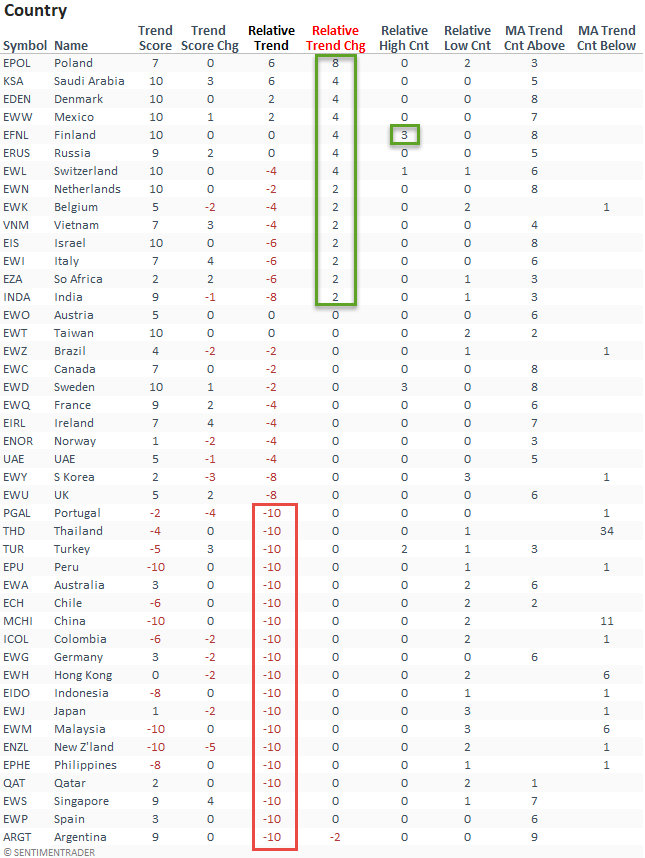
ABSOLUTE & RELATIVE TRENDS - COUNTRIES
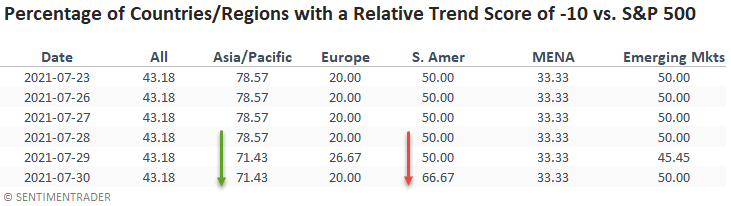
Suppose I sort the Country table by the relative trend score change column. In that case, it shows more countries with an improvement in their respective relative trend score on a w/w basis. However, relative lows continue to outpace relative highs. And, the percentage of countries with a relative trend score of -10 remained at a level that suggests negative forward returns for a broad-based global allocation.
GLOBAL RELATIVE TRENDS
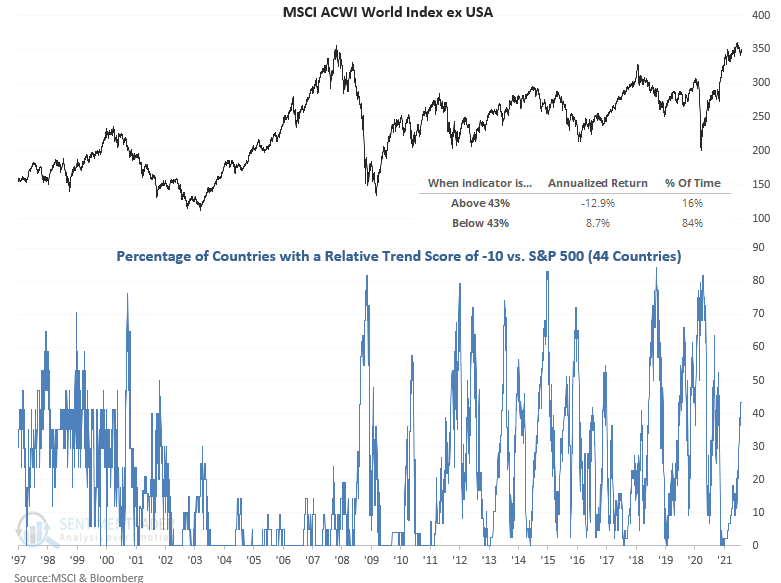
The percentage of countries with a positive relative trend score versus the S&P 500 showed a slight uptick on a w/w basis. However, the current level suggests an unfavorable environment for the MSCI ACWI World Index ex USA.
ALL COUNTRY RELATIVE TREND CHART
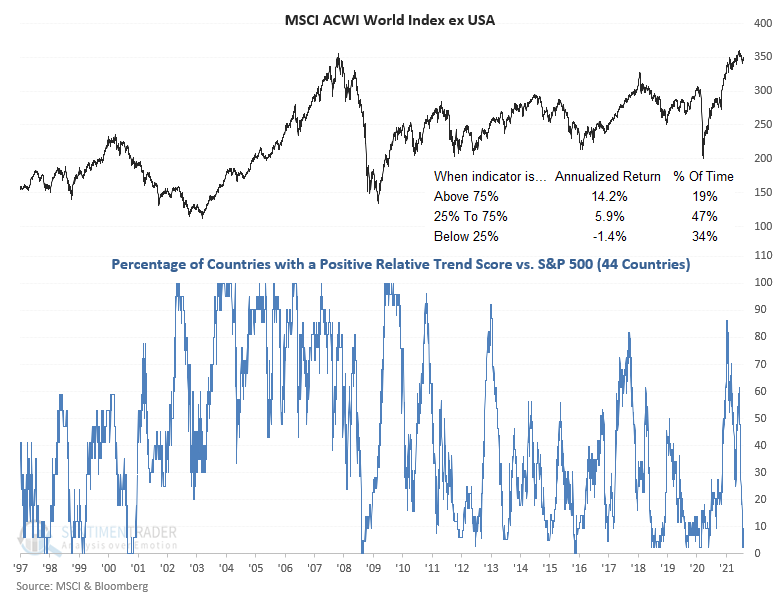
The percentage of countries with a relative trend score of -10 versus the S&P 500 remains at a level that suggests negative returns for the MSCI ACWI World Index ex USA.
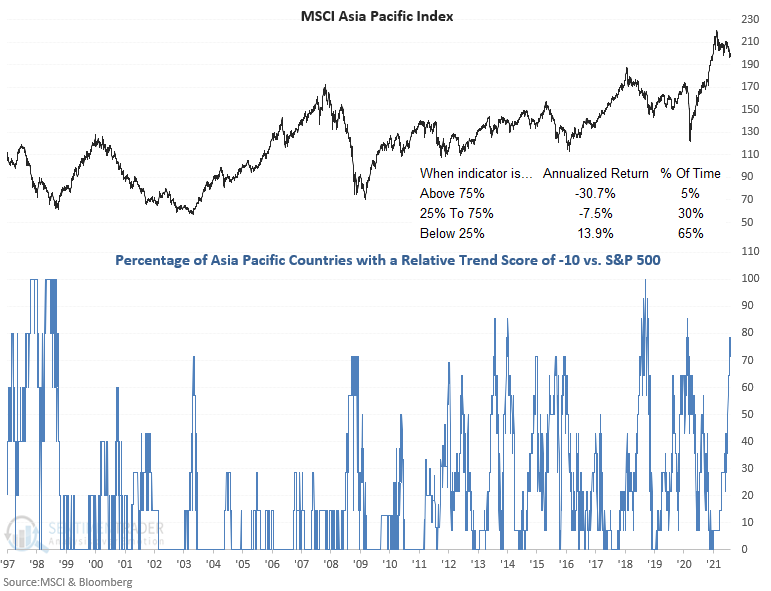
While the Asia Pacific region showed some improvement on a w/w basis, the percentage of countries with a relative trend score of -10 remains at a level that is concerning.
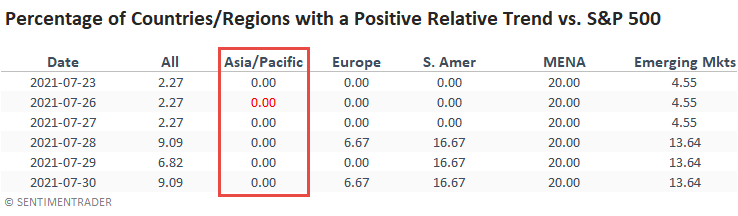
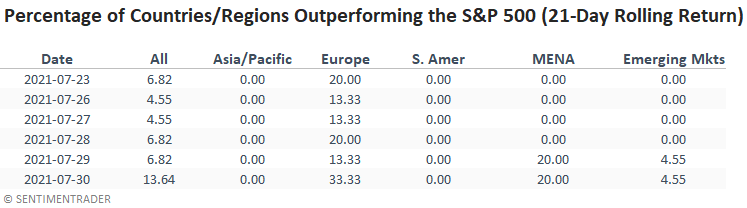
In a note on 7/7/21, I shared a study that assessed the forward return outlook for stocks when the percentage of countries outperforming the S&P 500 on a rolling 21-day basis falls to a low level. Here's a snapshot of the indicator broken down by worldwide regions.
ABSOLUTE AND RELATIVE TREND COLUMN DEFINITIONS
- Absolute Trend Count Score - The absolute trend model contains ten indicators to assess absolute trends across several durations.
- Absolute Trend 5-Day Change - This indicator measures the 5-day net change in the absolute trend model.
- Relative Trend Count Score - The relative trend model contains ten indicators to assess relative trends vs. the S&P across durations.
- Relative Trend 5-Day Change - This indicator measures the 5-day net change in the relative trend model.
- Relative High Count - This indicator measures the number of 21-day relative highs vs. the S&P 500 in the last 5 days.
- Relative Low Count - This indicator measures the number of 21-day relative lows vs. the S&P 500 in the last 5 days.
- Absolute and Relative Trend Scores range from 10 (Best) to -10 (Worst)
- MA Trend Cnt Above - This indicator counts the number of consecutive days above the 10-day moving average.
- MA Trend Cnt Below - This indicator counts the number of consecutive days below the 10-day moving average.