Absolute and Relative Trend Update
The goal of today's note is to provide you with some insight into what I am seeing with my absolute and relative trend following indicators for domestic and international ETFs.
Data as of 6/11/21 close. All relative comparisons are versus the S&P 500 ETF (SPY). For absolute and relative indicator definitions, please scroll down to the end of the note.
ABSOLUTE & RELATIVE TRENDS - SECTOR ETFS
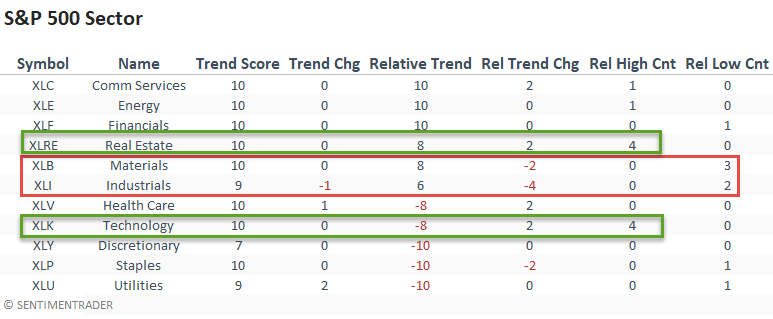
The deterioration in value-based sectors like industrials and materials appears to have come at the expense of the growth-oriented technology sector. Value has been a leader for some time, so it shouldn't a surprise to see some rotation into beaten-down technology stocks.

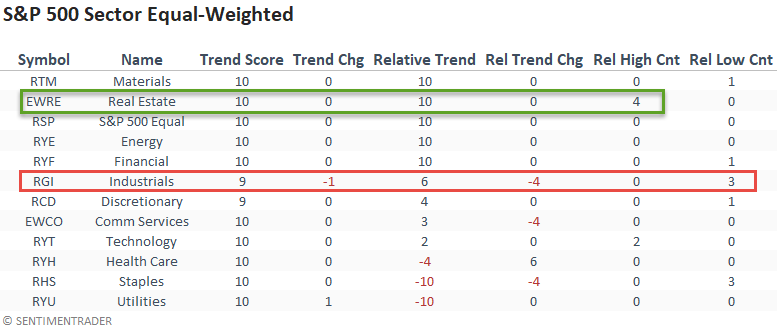
The equal-weighted industrial sector confirms the deterioration in the cap-weighted indicators. Interestingly, materials maintained a perfect relative trend score.
Small-cap continues to improve with better trend scores and more relative highs. The utilities/communications group improved to a perfect relative trend score and registered relative highs on 3/5 days last week. The improvement in health care is worth noting.
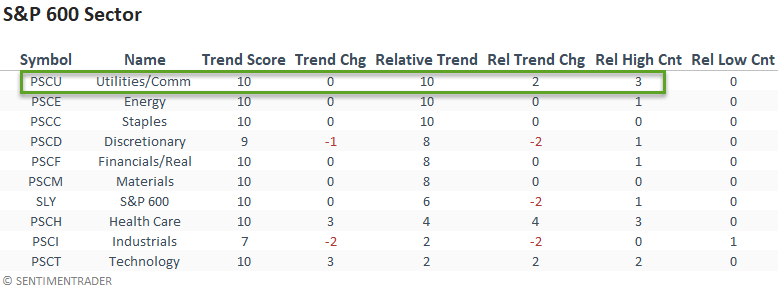
CHART IN FOCUS - S&P 500 INDUSTRIALS
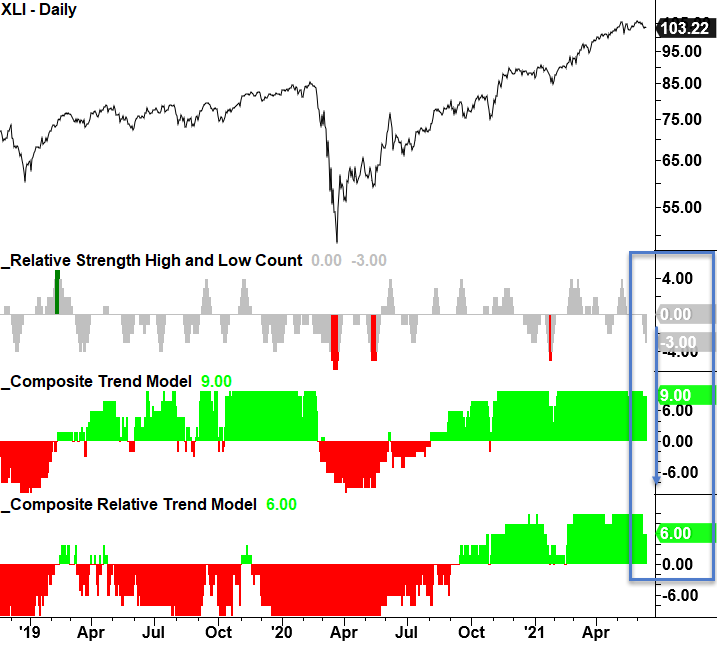
The industrials are worth monitoring as we most likely see peak economic growth rates this year.
ABSOLUTE & RELATIVE TRENDS - INDUSTRIES
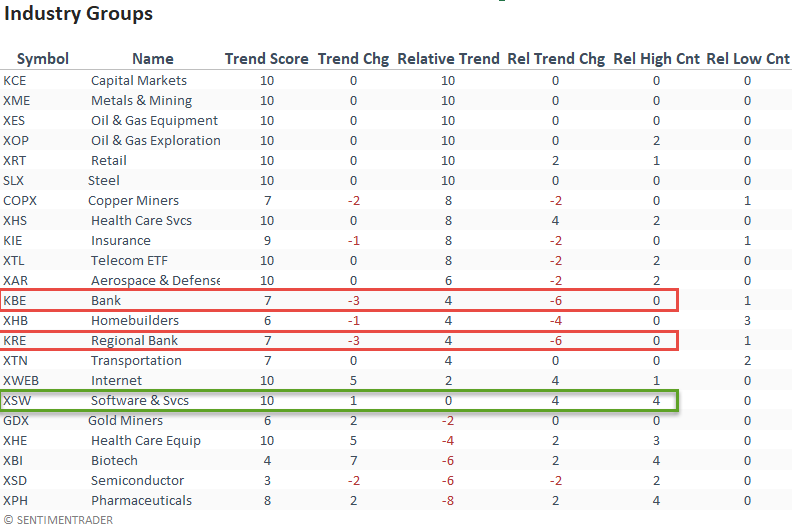
The relative trend score for banks had a sharp decline last week. I suspect the drop in the 10-year yield played a role. Software and services had a solid week with new relative highs on 4/5 days.
ABSOLUTE & RELATIVE TRENDS - THEMATIC ETFS
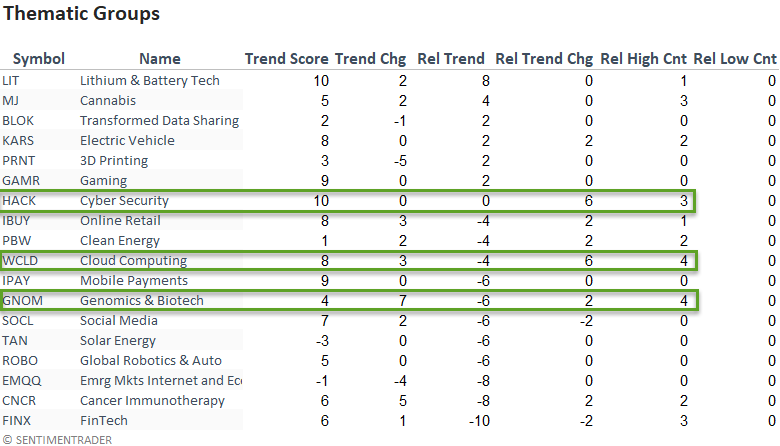
Thematic trends improved last week, with cloud computing and cybersecurity showing notable increases in relative trend scores.
ABSOLUTE & RELATIVE TRENDS - COUNTRIES
If I sort the Country table by relative trend score change, it clearly shows more negative than positive trend changes. Germany and Taiwan are interesting because they represent an economy that is more dependent on manufacturing and exports. Therefore, the relative trend changes would confirm the deterioration in the U.S industrial score last week.
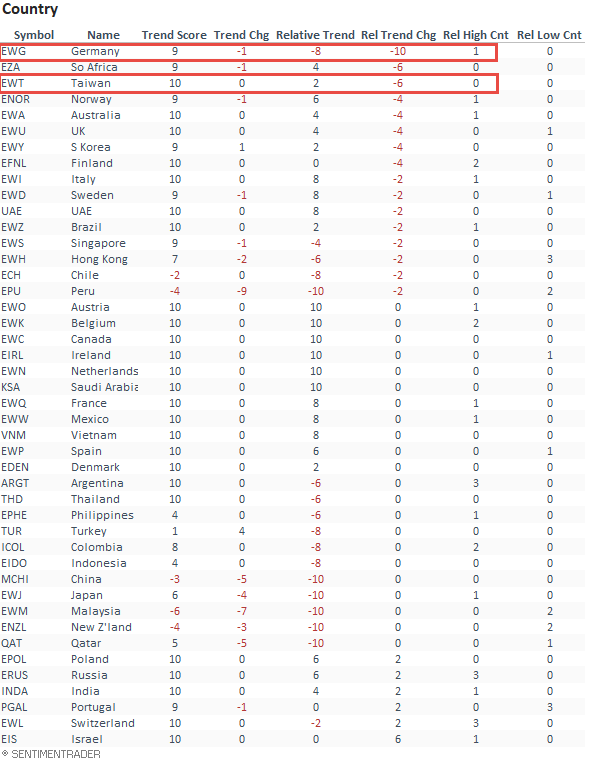
CHART IN FOCUS - GERMANY (EWG)
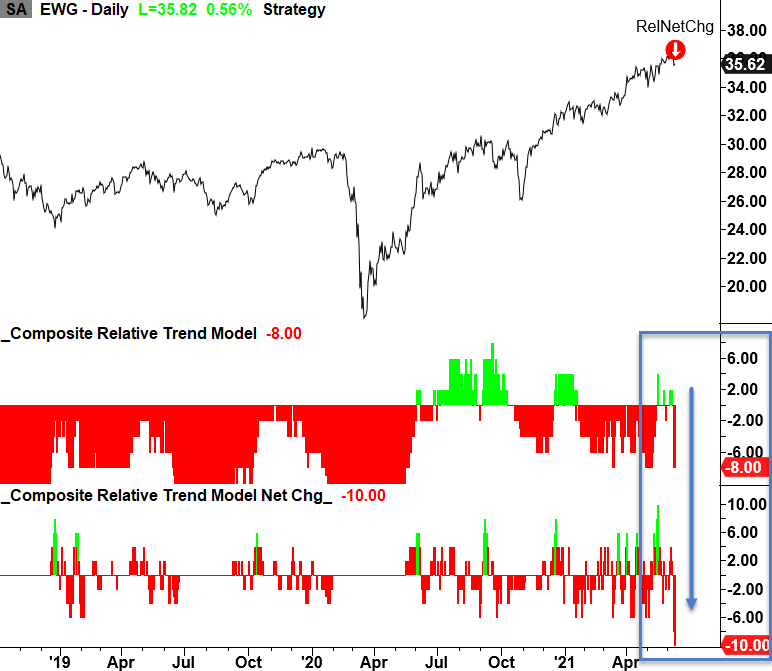
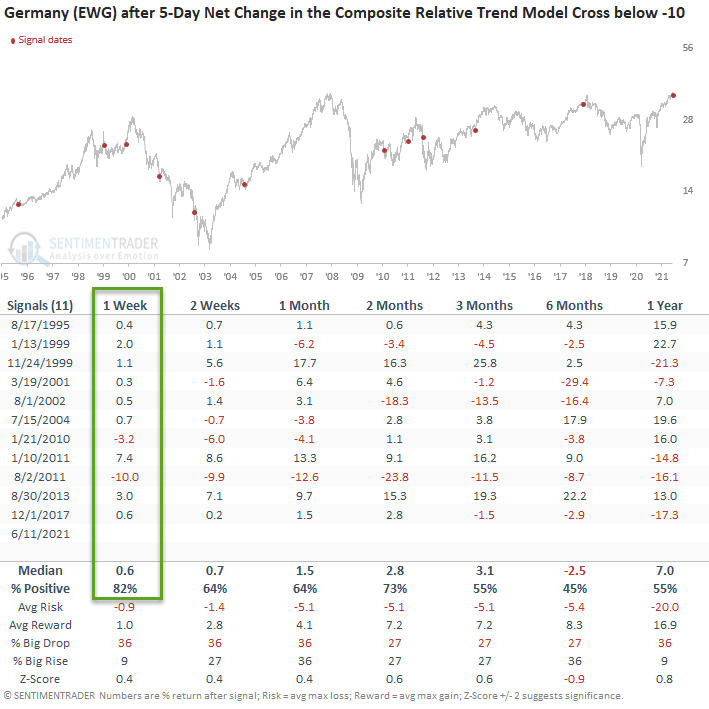
The composite relative trend model for Germany experienced a sharp contraction in its score on a w/w basis with a net change of -10. Let's run a study to assess forward returns when it contracts by -10.
HOW THE SIGNALS PERFORMED
The short-term results would suggest a mean reversion opportunity exists, especially in the 1-week timeframe. However, the long-term performance looks poor.
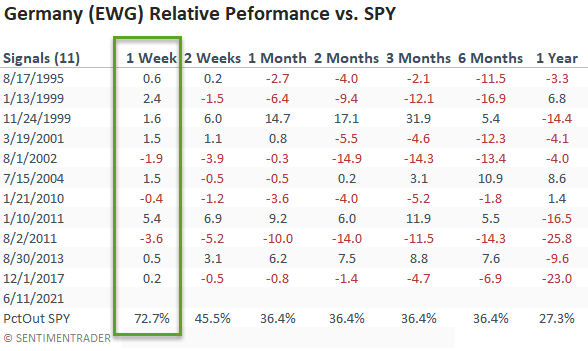
HOW THE SIGNALS PERFORMED RELATIVE
The relative performance versus the S&P 500 in the 1-week timeframe also suggests a short-term mean reversion opportunity.
GLOBAL RELATIVE TRENDS
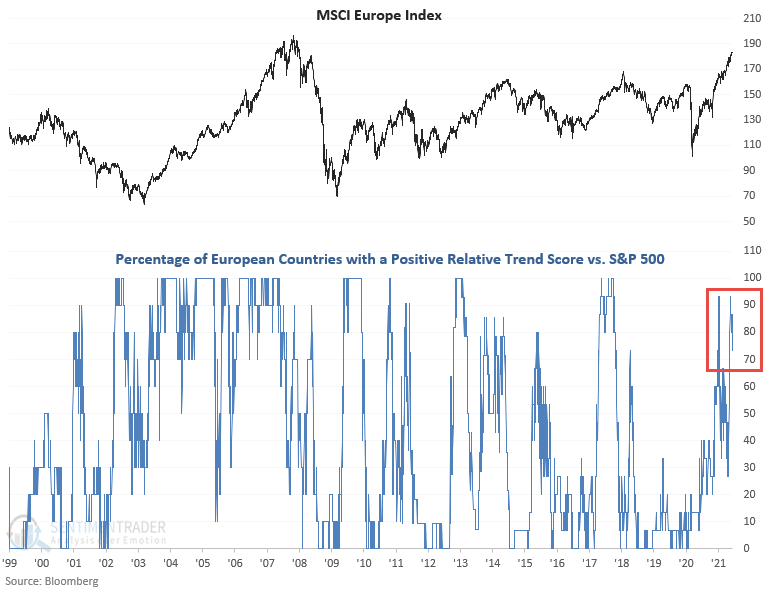
The percentage of European countries outperforming the S&P 500 index deteriorated last week at the expense of growth-oriented groups. The region is worth monitoring, given that it leans more toward value-oriented stocks.

EUROPE RELATIVE TREND CHART
ABSOLUTE AND RELATIVE TREND COLUMN DEFINITIONS
- Absolute Trend Count Score - The absolute trend model contains ten indicators to assess absolute trends across several durations.
- Absolute Trend 5-Day Change - This indicator measures the 5-day net change in the absolute trend model.
- Relative Trend Count Score - The relative trend model contains ten indicators to assess relative trends vs. the S&P across durations.
- Relative Trend 5-Day Change - This indicator measures the 5-day net change in the relative trend model.
- Relative High Count - This indicator measures the number of 21-day relative highs vs. the S&P 500 in the last 5 days.
- Relative Low Count - This indicator measures the number of 21-day relative lows vs. the S&P 500 in the last 5 days.
- Absolute and Relative Trend Scores range from 10 (Best) to -10 (Worst)

