
About That Rebound in Small Caps

Any serious market student recognizes that no sector or style ever holds a permanent advantage over any other sector or style. In other words, relationships change over time. One sector or style leads for a period of time, and then things swing back the other way.
That said, Small-Cap stocks have mostly underperformed large-cap stocks in recent years. As a result, there is much speculation as to when this state of affairs will change - or if it already has.
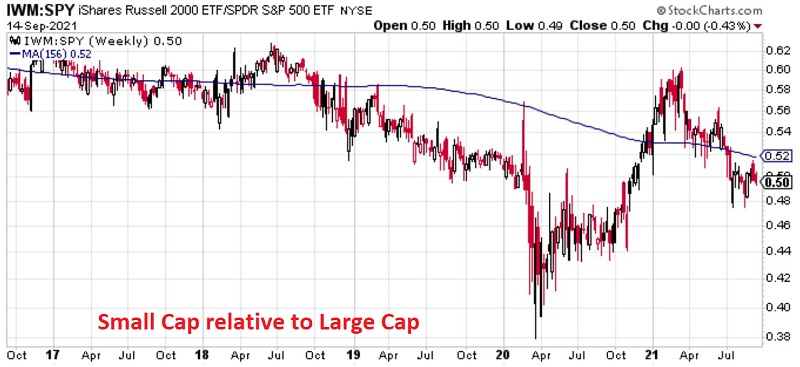
The chart below (courtesy of StockCharts) is a relative strength chart that displays the performance of ticker IWM (iShares Russell 2000 ETF ) versus the performance of ticker SPY (SPDR S&P 500 ETF Trust ) over the past 5 years.
- Rising bars mean small-caps are outperforming large-caps
- Falling bars mean small-caps are underperforming large-caps
What we see is pretty straightforward:
- The relationship was pretty even through about late September 2018
- From July 2018 through March 2020, small-caps vastly underperformed
- From March 2020 into March 2021, small-cap outperformed large-caps
- Since March 2021, small-caps have again underperformed
Back-and-forth, give-and-take, so on and so forth. So, no surprise, many investors look for small caps to reassert themselves relative to large caps. And perhaps they will.
But history suggests that you might consider waiting just a little longer before making that bet.
SMALL-CAP SEASONAL WEAKNESS
For testing purposes, we will use a small-cap index going back to 1953. This index is comprised of:
- The total return for the Fama French small-cap style index from 1953 until 1990
- The total return for the Russell 2000 Index from 1990 forward
Let's focus on the period extending from:
- The close on Trading Day of the Year #179
- Through the close of Trading Day of the Year #196
The chart below displays the year-by-year % return for the index during this period
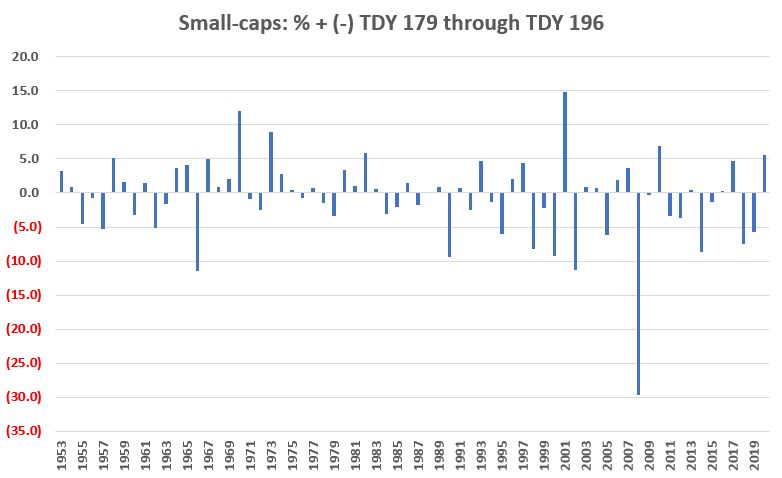
Things to note:
- # of Times UP = 36
- # of Times Down = 32
- Average UP % = +3.2%
- Average DOWN % = (-5.1%)
The bottom line is that on a year-to-year basis, whether this period shows a gain or a loss is a little better than a coin-flip (53% up, 47% down). However, the average losing period is worse than the average winning period. This explains the results in the chart below, which displays the cumulative % + (-) for the small-cap index during this "unfavorable" period.
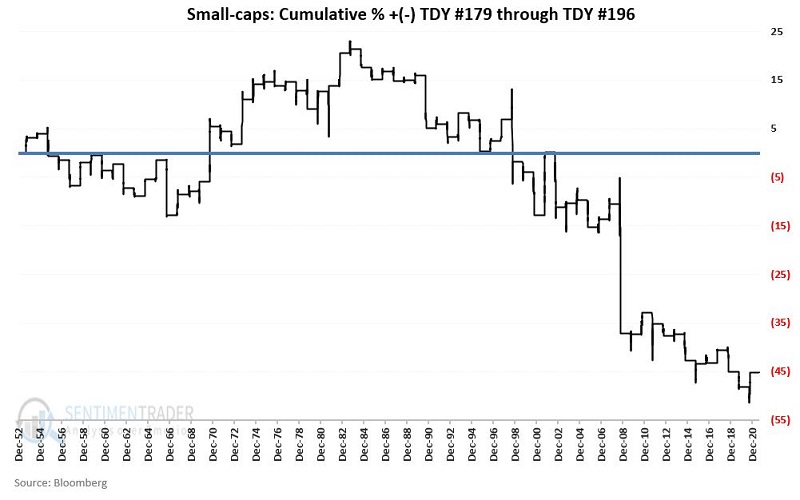
The cumulative return for the small-cap index held ONLY from TDY 179 through TDY #196 every year since 1953 is -46%.
To put this into context, the chart below displays the cumulative return for the small-cap index if held during ALL OTHER DAYS of the year.
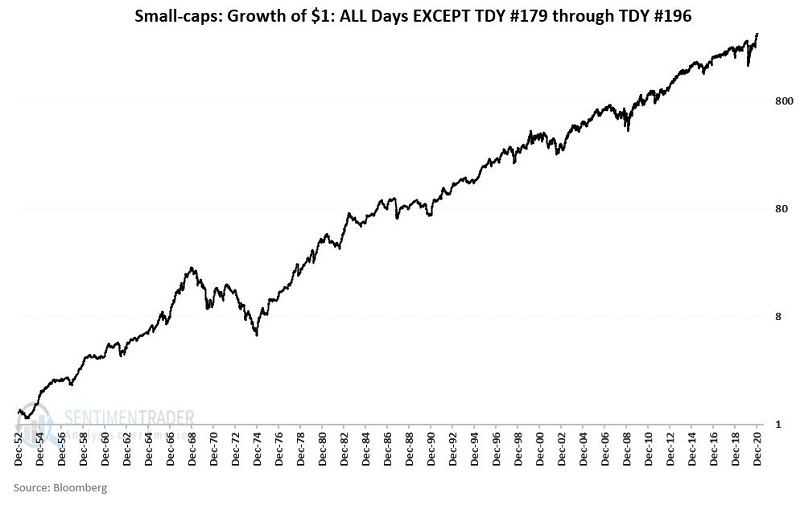
From January 1, 1953, through August 31st, 2021, the cumulative total return during these days was +374,570%.
SUMMARY
Many investors have been feeling the temptation lately to take the plunge into small-cap stocks on the notion that they are "overdue" to outperform. However, if you fit into this category, history suggests that you exhibit patience for at least a little while longer.