
About that near-miss Zweig Breadth Thrust

Key points
- The bad news is that the market failed to achieve an "official" Zweig Breadth Thrust
- The good news is that it came close - and historically, that's typically been a good sign
- Following any ZBT cross above 60%, 12-month Win Rates for the S&P 500 and Nasdaq 100 are 91% and 98%, respectively
A near miss
An official Zweig Breadth Thrust occurs when the 10-day moving average for the percentage of advancing stocks on the New York Stock Exchange rises from 40% or lower to 61.5% or higher in ten trading days or less.
This signal has only happened 18 times since 1945. The most recent signal was on 2024-11-3. Following the previous 17 signals, the S&P 500 rose over the next 12 months 100% of the time, with a median gain of +22.9%. Since 2024-11-03, the S&P 500 has gained +19%.
The indicator (i.e., the 10-day average of NYSE advances versus declines) recently completed a run from 36% to 63%. However, the move took more than ten trading days to complete. So technically, it failed to qualify as an "official" Zweig Breadth Thrust. That's the bad news.
The good is that it might not matter all that much.
The history of near misses
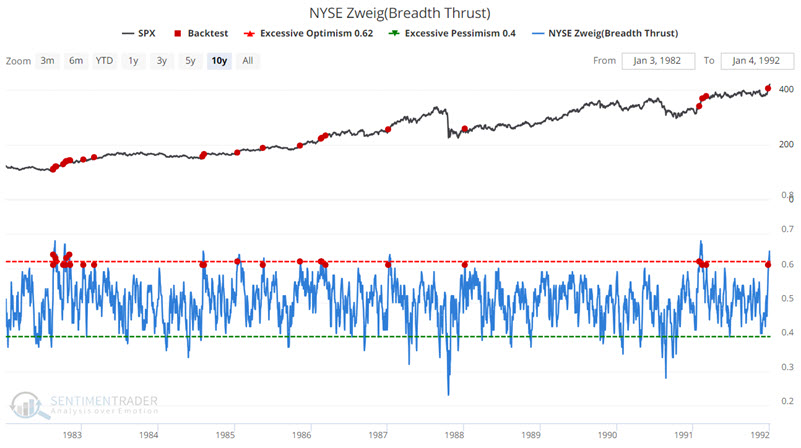
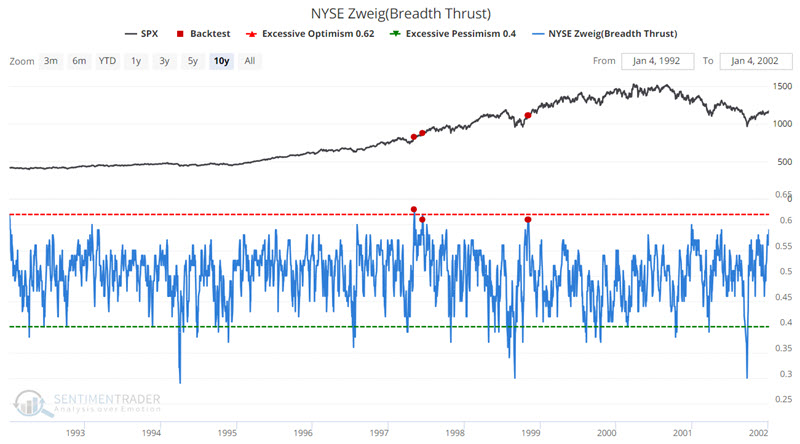
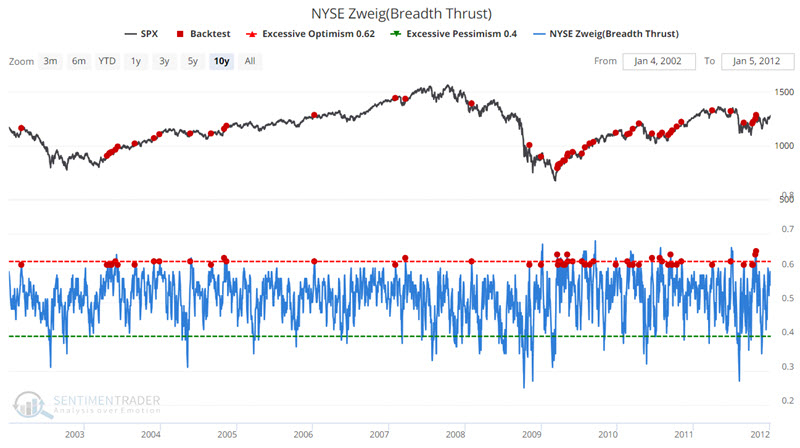
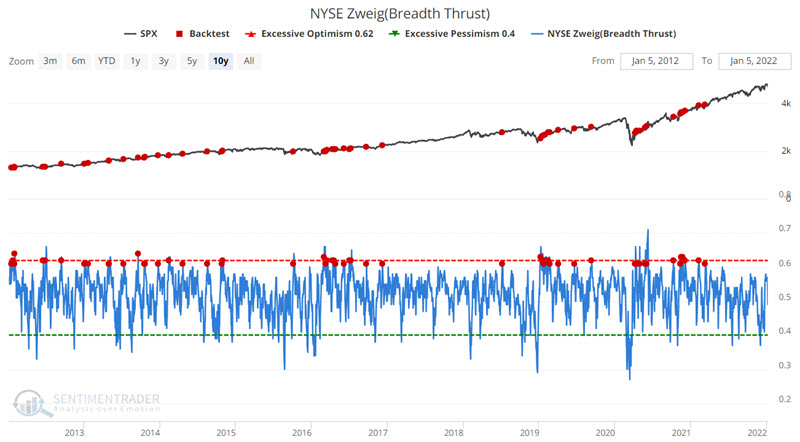
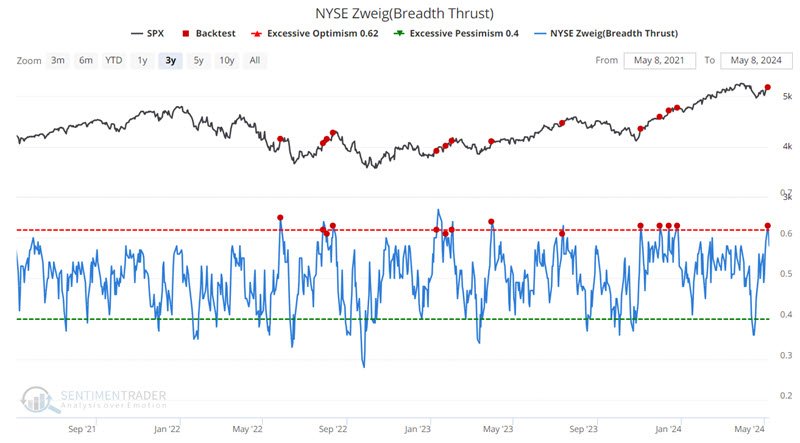
Let's consider a much less stringent test. For this test, we will consider any reading by our Zweig Breadth Thrust indicator that crosses above 0.60 (i.e., 60%).
The chart below highlights all dates when the ZBT crossed above 0.60, regardless of whether it first dropped below 0.40. In other words, any crosses above 0.60 are considered. The most recent signal occurred on 2023-05-06.
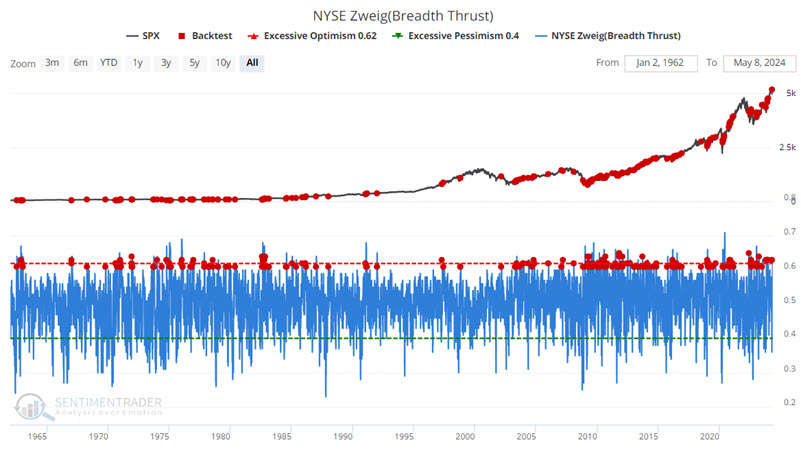
Just eyeballing the chart suggests that this signal tends to occur within the context of a new or ongoing bull market. The results below, which summarize SPX performance following these signals, appear to quantify that subjective take.
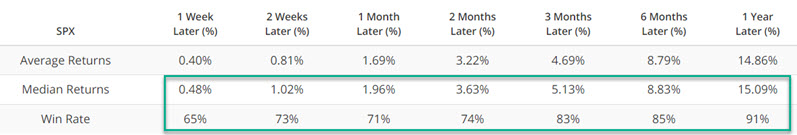
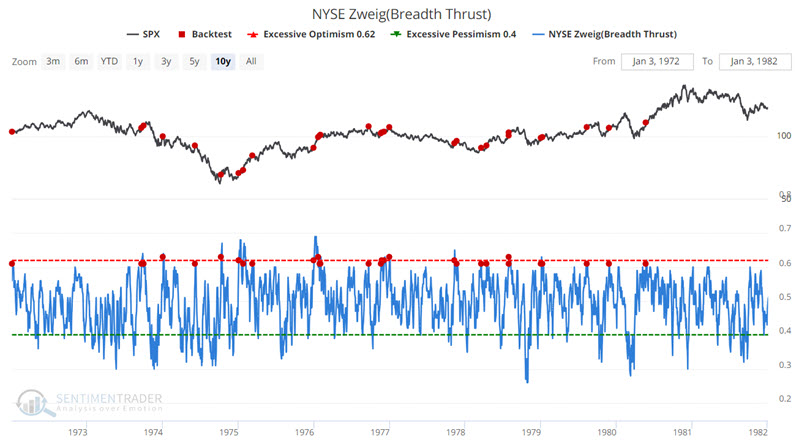
The critical thing to note is the high Win Rates across the board. The charts below show signals ten years at a time. 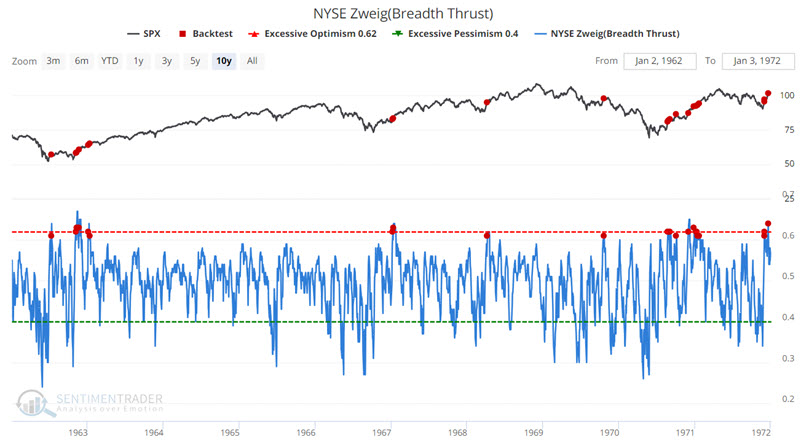
A look at the Nasdaq 100
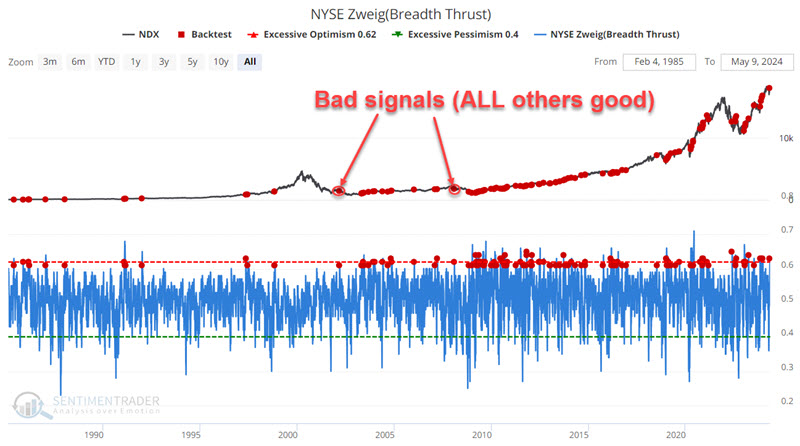
We also get some interesting results if we apply an NYSE Zweig Breadth Thrust crossing above 0.60 to the Nasdaq 100 Index.
The chart below uses the Nasdaq 100 as the measuring stick and highlights all dates when the ZBT crossed above 0.60, regardless of whether or not it first dropped below 0.40. In other words, any crosses above 0.60 are considered.
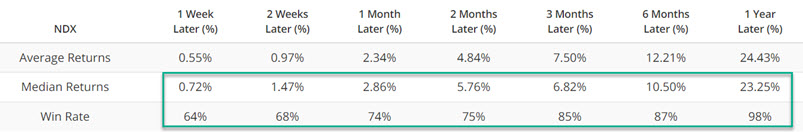
The table below summarizes Nasdaq 100 performance.
As with most all things in the market, nothing is ever perfect. Consider the following tradeoff.
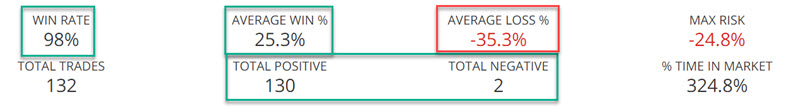
The good news: As you can see in the screenshot below, of the 132 signals versus the Nasdaq 100 since 1985, the Nasdaq 100 has shown a subsequent 12-month gain 130 times and a loss only twice.
The bad news: The losses were a -35.08% loss following the 2002-03-06 signal and a -35.55% loss following the 2008-02-01 signal.
What the research tells us…
The bottom line: The recent cross above 60% by the Zweig Breadth Thrust indicator does not guarantee that the S&P 500 and Nasdaq 100 are sure to rise over the next year. Nevertheless, history strongly suggests that investors give bullish case the benefit of the doubt until they are given a solid reason to think otherwise.
Jay's Trading Maxim #18: Follow the trend, but DO NOT fall in love with the trend.