Data &
Technology
Research
Reports
Report Solutions
Reports Library
Actionable
Strategies
Free
Resources
Simple Backtest Calculator
Simple Seasonality Calculator
The Kelly Criterion Calculator
Sentiment Geo Map
Public Research Reports
Free Webinar
Pricing
Company
About
Meet Our Team
In the News
Testimonials
Client Success Stories
Contact
Log inLoginSign up
< BACK TO ALL REPORTS

A Yen for the Yen

Jay Kaeppel
2021-07-08
Countertrend traders may find an opportunity in the Japanese Yen in the months ahead. In this piece, we spell out the details.

I recently came across the charts below displaying the currency cross between the Japanese Yen and various other currencies (charts are courtesy of www.AllStarCharts.com).

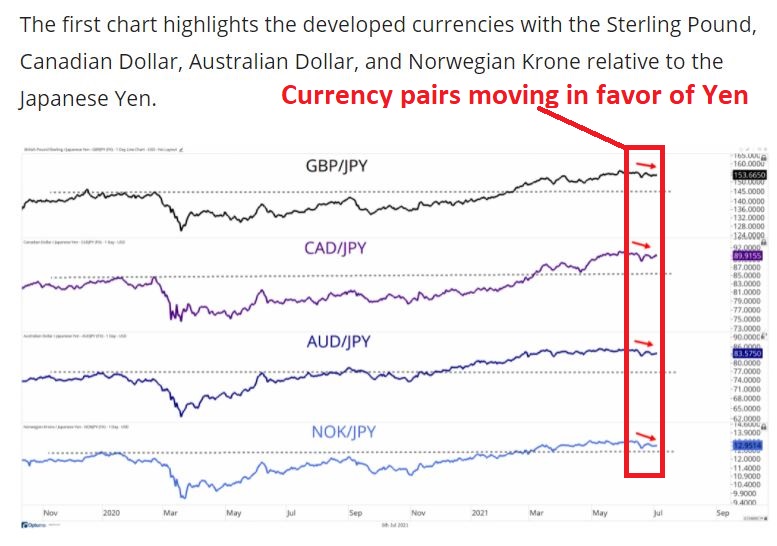
The primary thing that was pointed out was that the yen appeared to be strengthening against other currencies. This can happen in one of two ways:

  • The yen goes up more than the other currencies
  • The yen goes down less than the other currencies

Since I don't trade Forex or currency cross rates, I am more interested in the former - and in potentially taking a long position if the yen appears poised to advance. 

PRICE ACTION

The chart below (courtesy of www.Stockcharts.com) displays a 5-year weekly bar chart of the Yen versus the US Dollar.

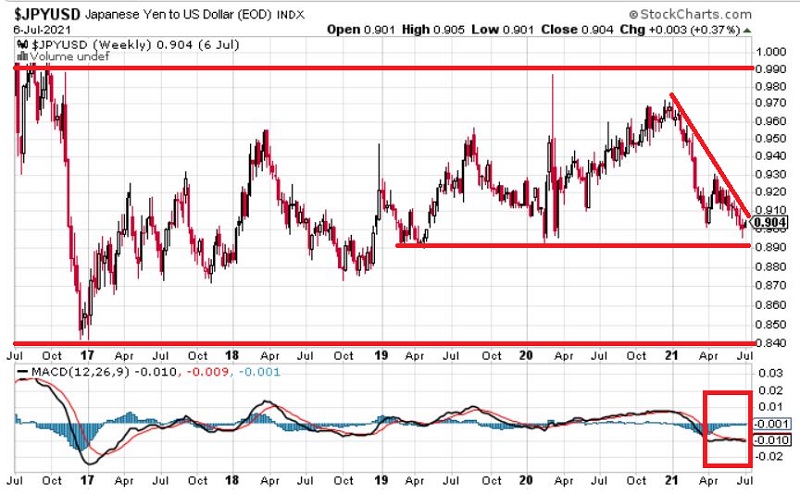
As with most charts, a trader can see pretty much whatever they want to see:

  • One trader will see a market clearly in a downtrend (basically during all of 2021)
  • One trader will see a market trapped in a large multi-year trading range (between 0.84 and 1.00)
  • Another trader will see a market poised to reverse to the upside (based on potential support and an anticipated upside reversal in MACD)

Again, this is all firmly in the "eye of the beholder." So, let's look for another clue.

SEASONALITY

The chart below displays the Annual Seasonal Trend for the Japanese Yen. 

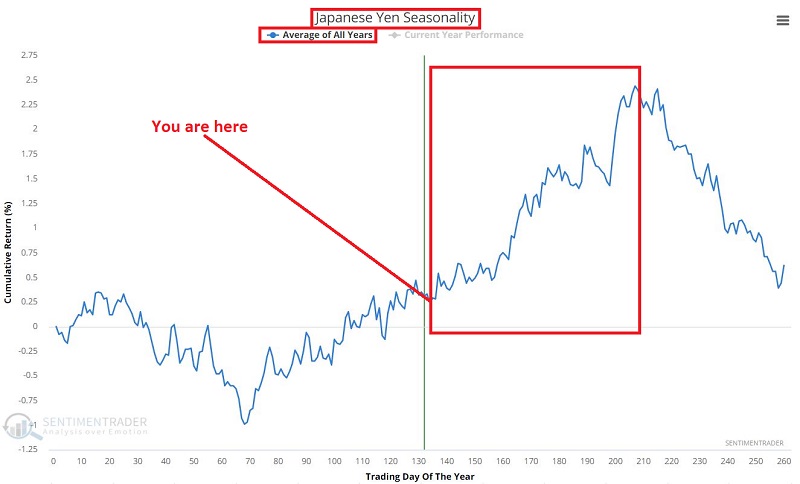
As you can see, we are moving into what is generally a favorable time of year for the yen. Let's take a closer look at how this trend has played out in the past.

The chart below displays the year-by-year $ gain/loss for yen futures held long during our "favorable" period every year since 1976. 

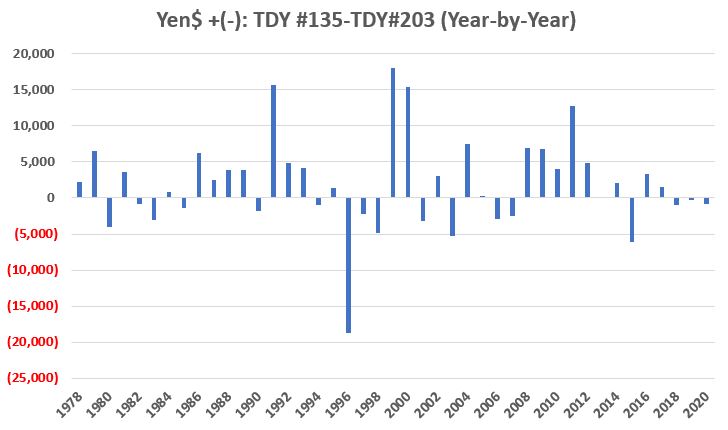
The huge loss in 1996 serves as our reminder that there are no sure things in trading and that managing risk is still the "Key to the Kingdom" regardless of the asset and method involved.

The chart below displays the cumulative results of the year-by-year results displayed above.
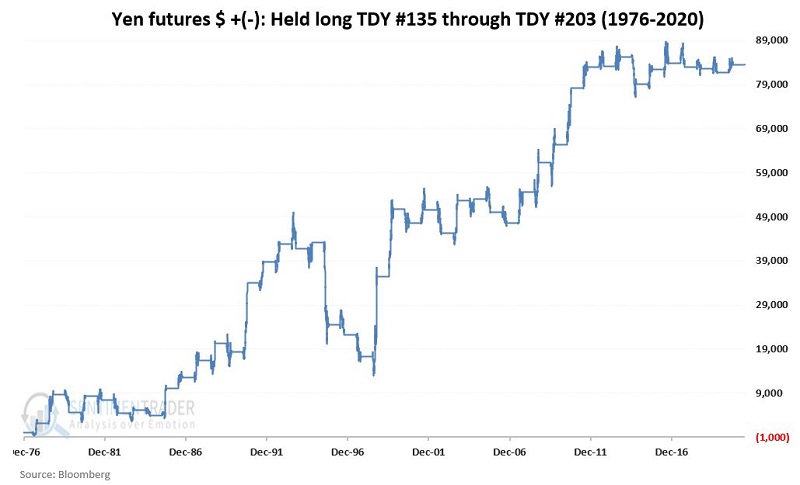
In sum:

  • The yen showed a gain 26 times (60%)
  • The yen showed a loss 17 times (40%)
  • The average $ gain was +$5,462
  • The average $ loss was (-$3,542)
  • The median $ gain was +$3,931
  • The average $ loss was (-$2,438)

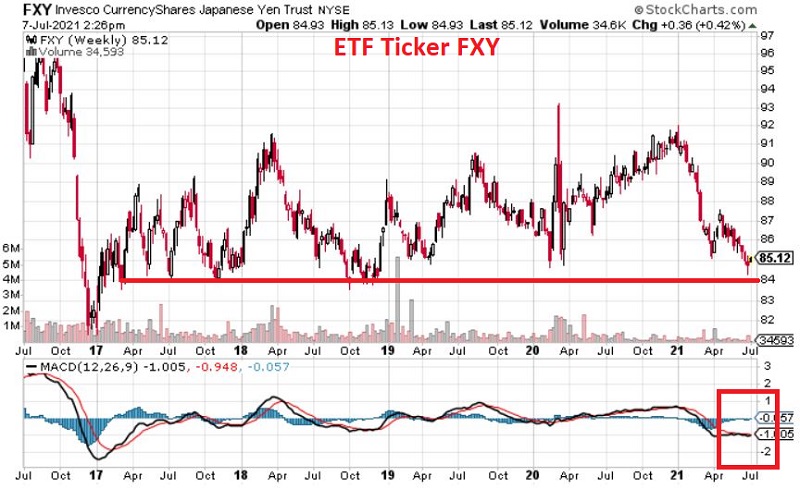
THE NON-FUTURES AND NON-FOREX ALTERNATIVE

Non-futures traders can consider the ETF ticker FXY (Invesco CurrencyShares Japanese Yen Trust), which tracks Japanese Yen futures and can be bought and sold like shares of stock. Ticker FXY has support near $84 a share, and - like the futures - MACD is close to crossing over but has not yet done so.

Sorry, you don't have access to this report

Upgrade your subscription plan to get access
Go to Dasboard
DATA &
TECHnologies
IndicatorEdge
‍
BackTestEdge
‍
Other Tools
‍
DataEdge API
RESEARCH
reports
Research Solution
‍
Reports Library
‍
actionable
Strategies
Trading Strategies
‍
Smart Stock Scanner
‍
FREE
RESOUrCES
Simple Backtest
Calculator
Simple Seasonality
Calculator
The Kelly Criterion
Calculator
Sentiment Geo Map
‍
Public Research Reports
‍
Free Webinar
COMPANY
‍
About
‍
Meet our Team
‍
In the News
‍
Testimonials
‍
Client Success Stories
Pricing
Bundle pricing
‍
Announcements
‍
FAQ
© 2024 Sundial Capital Research Inc. All rights reserved.
Setsail Marketing
TermsPrivacyAffiliate Program
Risk Disclosure: Futures and forex trading contains substantial risk and is not for every investor. An investor could potentially lose all or more than the initial investment. Risk capital is money that can be lost without jeopardizing ones’ financial security or life style. Only risk capital should be used for trading and only those with sufficient risk capital should consider trading. Past performance is not necessarily indicative of future results.

Hypothetical Performance Disclosure: Hypothetical performance results have many inherent limitations, some of which are described below. No representation is being made that any account will or is likely to achieve profits or losses similar to those shown; in fact, there are frequently sharp differences between hypothetical performance results and the actual results subsequently achieved by any particular trading program. One of the limitations of hypothetical performance results is that they are generally prepared with the benefit of hindsight. In addition, hypothetical trading does not involve financial risk, and no hypothetical trading record can completely account for the impact of financial risk of actual trading. for example, the ability to withstand losses or to adhere to a particular trading program in spite of trading losses are material points which can also adversely affect actual trading results. There are numerous other factors related to the markets in general or to the implementation of any specific trading program which cannot be fully accounted for in the preparation of hypothetical performance results and all which can adversely affect trading results.

Testimonial Disclosure: Testimonials appearing on this website may not be representative of other clients or customers and is not a guarantee of future performance or success.