Indicators &
Backtest Tools
Research
Reports
Report Solutions
Reports Library
Strategies
& Scanner
Free
Resources
Simple Backtest Calculator
Simple Seasonality Calculator
The Kelly Criterion Calculator
Sentiment Geo Map
Public Research Reports
Pricing
Company
About
In the News
Testimonials
Client Success Stories
Contact
Log inLoginSign up
< BACK TO ALL REPORTS

A Worrisome - and Little Known - Inflationary Warning Sign

Jay Kaeppel
2021-06-02
When the Producer Price Index vastly exceeds the Consumer Price Index, it has generally portended trouble for the stock market. In this piece, we detail exactly how to analyze this important - and little-known - measure and highlight what it has meant for stocks in the past.

Last month the Producer Price Index (PPI) registered a 12-month rate-of-change of +17.25%, and the Consumer Price Index (CPI) registered a 12-month rate-of-change of +4.07%. 

As the PPI is often thought to lead the CPI, this is a cause of concern for many. 

The chart below displays the 12-month % change in the PPI and CPI on one chart. As you can see, while the two indices typically trend in a similar direction, the PPI tends to be much more volatile than the CPI and will occasionally move significantly above or below the CPI.

One theory of concern is the notion that a spike in the PPI well above the CPI may signal an impending bout of significant inflation and that this might be negative for the stock market.

Is there anything to this theory? As it turns out, the answer - unfortunately - appears to be "Yes." 

THE TEST

The chart below shows the monthly PPI 12-month change minus the CPI 12-month change, with a cutoff level of positive 7.

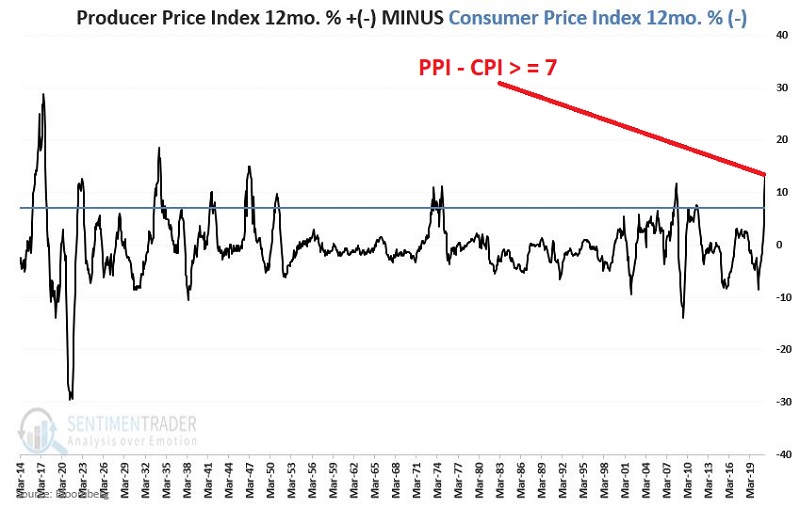
We want to identify those periods when the difference between PPI and CPI inflation is greater than 7 percentage points and look at the performance of the stock market during these periods.

For our test, we examine the state of PPI inflation and CPI inflation at the end of each month:

  • If PPI - CPI is < 7, we consider this "normal" - and thus bullish for the stock market
  • If PPI - CPI is >= 7, we consider this "abnormal" - and thus bearish for the stock market

The table below displays only those periods when PPI - CPI was >= 7 and the price performance of the Dow Jones Industrial Average during those periods.

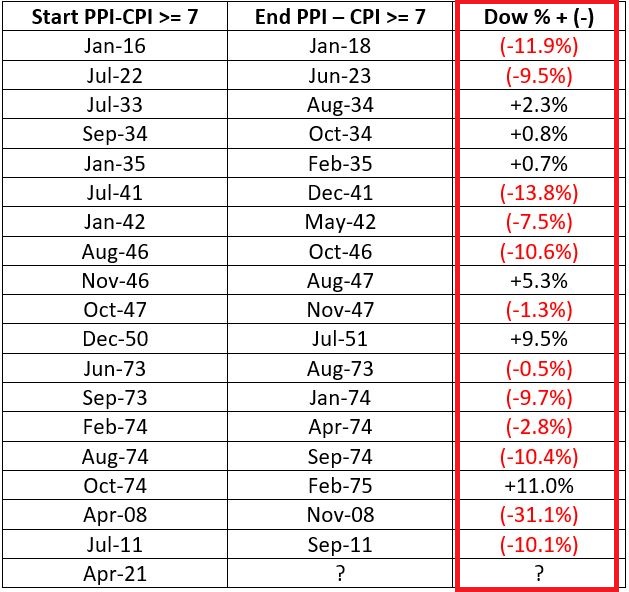
Overall, the historical results have been extremely unfavorable for stocks. To wit:

  • # of periods Dow UP = 6
  • # of periods Dow DOWN = 12
  • Median UP period Dow % = +3.8%
  • Median DOWN period Dow % = (-9.9%)
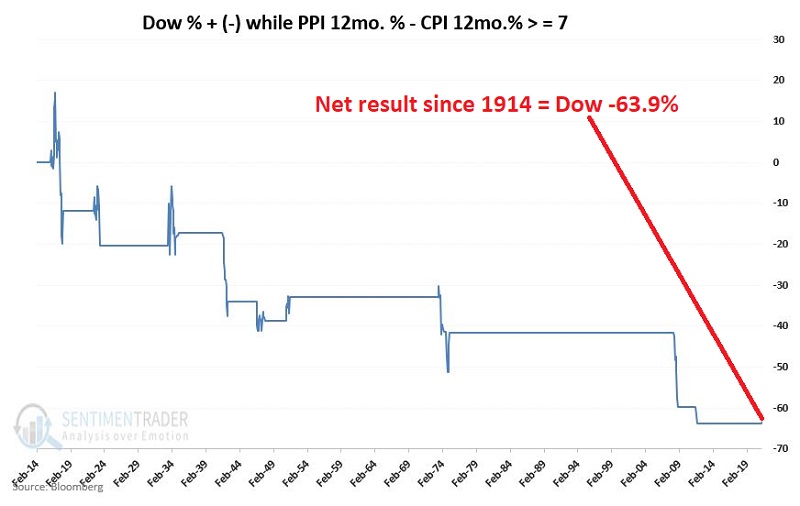
  • Cumulative Dow % +(-) = (-63.9%)

The chart below displays the cumulative % +(-) for the DOW only during those months when PPI - CPI >= 7. The results have been consistently negative for stocks.

THE CURRENT STATUS

  • At the end of April, the PPI 12mo% change - CPI 12mo% change stood at a bearish +9.43
  • At the end of May, this reading stood at +13.18

The good news is that the stock market shrugged off this piece of bad news in May and worked its way slightly higher. As with any indicator, there is no reason why the stock market must sell off just because some indicator value is beyond what some analyst deems bearish.

Nevertheless, it is worth keeping a close eye on these two inflation measures - and the stock market itself - in the days ahead. The longer the bearish inflation readings persist, the greater the likelihood that trouble may develop in the stock market.

Sorry, you don't have access to this report

Upgrade your subscription plan to get access
Go to Dasboard
Indicators & Backtest Tools
IndicatorEdge
‍
BackTestEdge
‍
Other Tools
‍
DataEdge API
RESEARCH
reports
Research Solution
‍
Reports Library
‍
Strategies & Scanner
Trading Strategies
‍
Smart Stock Scanner
‍
FREE
RESOUrCES
Simple Backtest
Calculator
Simple Seasonality
Calculator
The Kelly Criterion
Calculator
Sentiment Geo Map
‍
Public Research Reports
‍
COMPANY
‍
About
‍
In the News
‍
Testimonials
‍
Client Success Stories
Pricing
Bundle pricing
‍
Announcements
‍
FAQ
© 2025 Sundial Capital Research Inc. All rights reserved.
Setsail Marketing
TermsPrivacyAffiliate Program
Risk Disclosure: Futures and forex trading contains substantial risk and is not for every investor. An investor could potentially lose all or more than the initial investment. Risk capital is money that can be lost without jeopardizing ones’ financial security or life style. Only risk capital should be used for trading and only those with sufficient risk capital should consider trading. Past performance is not necessarily indicative of future results.

Hypothetical Performance Disclosure: Hypothetical performance results have many inherent limitations, some of which are described below. No representation is being made that any account will or is likely to achieve profits or losses similar to those shown; in fact, there are frequently sharp differences between hypothetical performance results and the actual results subsequently achieved by any particular trading program. One of the limitations of hypothetical performance results is that they are generally prepared with the benefit of hindsight. In addition, hypothetical trading does not involve financial risk, and no hypothetical trading record can completely account for the impact of financial risk of actual trading. for example, the ability to withstand losses or to adhere to a particular trading program in spite of trading losses are material points which can also adversely affect actual trading results. There are numerous other factors related to the markets in general or to the implementation of any specific trading program which cannot be fully accounted for in the preparation of hypothetical performance results and all which can adversely affect trading results.

Testimonial Disclosure: Testimonials appearing on this website may not be representative of other clients or customers and is not a guarantee of future performance or success.