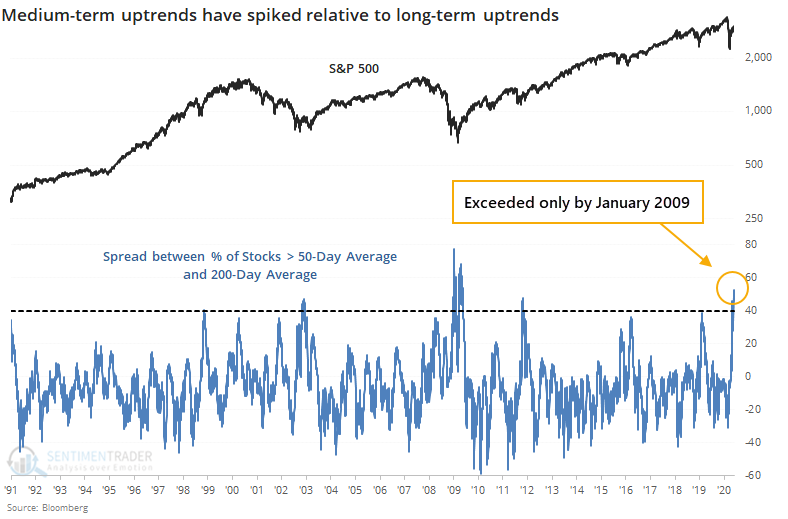
A wide spread between trends
We've spent a lot of time looking at the 50- and 200-day moving averages over the past week, and this will likely be one of the last posts about it for a long while. This form of looking at the market has become wildly popular lately and while that doesn't mean it's no longer effective, it's certainly becoming less unique.
There has been a surge in stocks within the S&P 500 rising above their 50-day moving averages but relatively few have climbed above their 200-day averages. As of Wednesday, 95% of S&P stocks were above their 50-day average but only 43% were above their 200-day, so the spread between them was more than 50%. That's the 2nd-highest in 30 years, next to January 2009.

By the time the spread hit 40%, it indicated moments of medium-term upside momentum during markets that were showing longer-term struggles. As a result, forward returns were shaky in the shorter-term, but positive over the next 6-12 months every time.
This is an abridged version of our recent reports and notes. For immediate access with no obligation, sign up for a 30-day free trial now.
We also looked at:
- The S&P 500 has cycled from more than 25% below its medium-term average to 10% above it
- The S&P and Nasdaq are leading the "big four" above their long-term averages
- Economic sentiment in the euro area is curling higher
- There has been a jump in stocks at 8-week highs in the S&P, DAX, and Nikkei
- Stocks in the U.S., Australia, and Japan are showing extremely high optimism
- What happens after the U.S. dollar falls to a 2-month low after a recent spike

