Data &
Technology
Research
Reports
Report Solutions
Reports Library
Actionable
Strategies
Free
Resources
Simple Backtest Calculator
Simple Seasonality Calculator
The Kelly Criterion Calculator
Sentiment Geo Map
Public Research Reports
Free Webinar
Pricing
Company
About
Meet Our Team
In the News
Testimonials
Client Success Stories
Contact
Log inLoginSign up
< BACK TO ALL REPORTS

A whole week with more than 90% of S&P members in short-term uptrends

Jason Goepfert
2022-01-03
After a mild oversold reading in December, more than 90% of stocks in the S&P 500 traded above their 10-day moving averages. That thrust continued for all of the last week of December, one of the longest positive streaks in 70 years. Similar behavior preceded more gains for the index.

Key points:

  • Almost all S&P 500 members are trading above their 10-day moving averages
  • More than 90% of stocks have held above that average for a week straight
  • Similar thrusts and streaks preceded gains for the S&P over the next 6 months almost without exception

Yet another positive breadth thrust

In early December, buying interest across stocks was broad and urgent. More than 80% of volume on the NYSE flowed into advancing securities, triggering a rare breadth thrust.

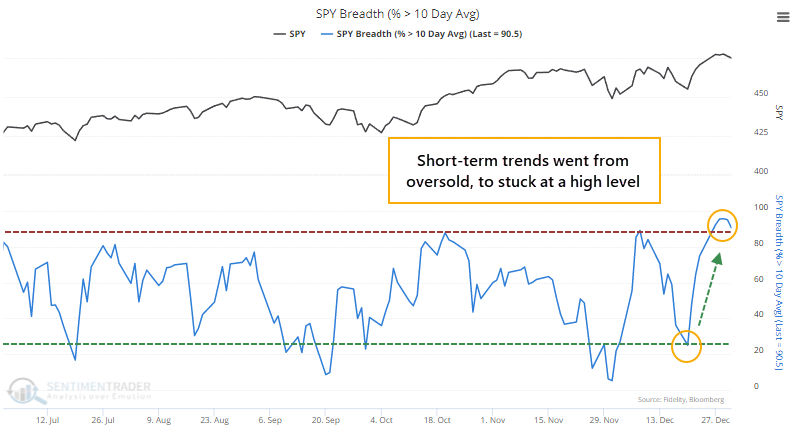
Within the most benchmarked index in the world, buying interest has been just as impressive. The percentage of S&P 500 member stocks trading above their 10-day moving averages cycled from only 25% on December 20 to more than 90% by last week.

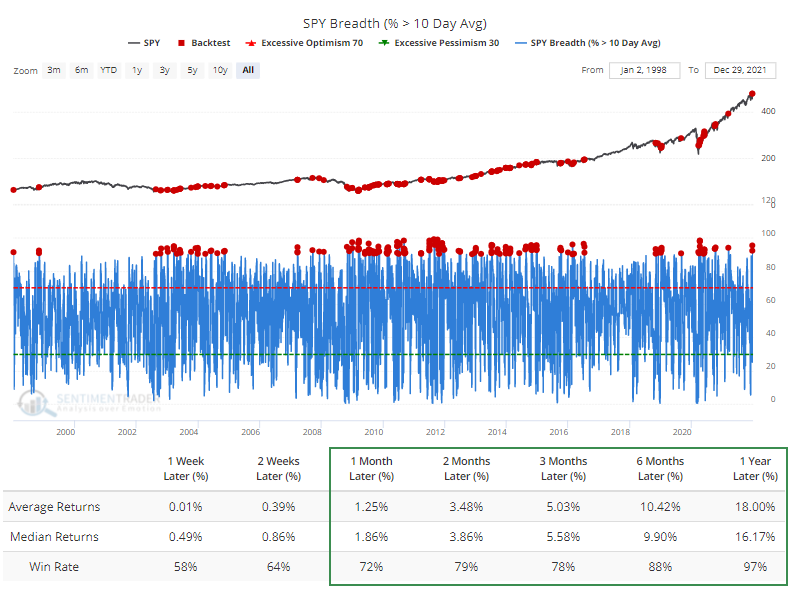
The Backtest Engine shows that since 1998, the S&P 500 performed well after more than 90% of its stocks traded above their 10-day averages, preceding a positive one-year return after 187 out of 193 signals.

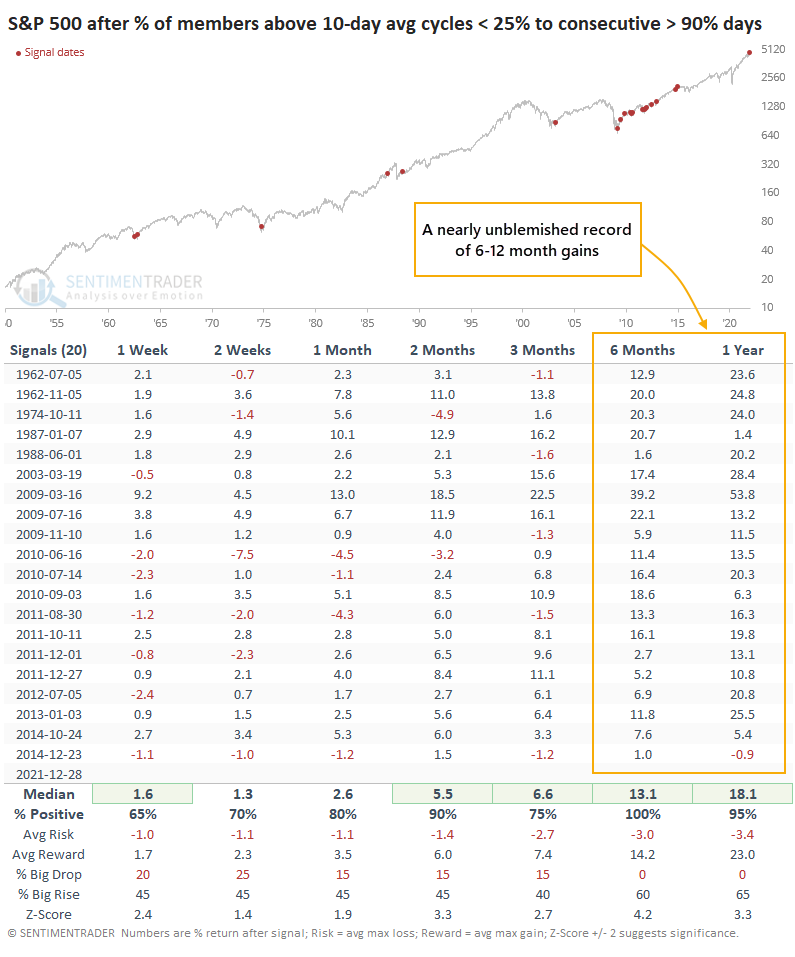
When these short-term trends cycled from below 25% (rounded) to above 90% on consecutive days, the S&P never lost ground over the next 6 months.

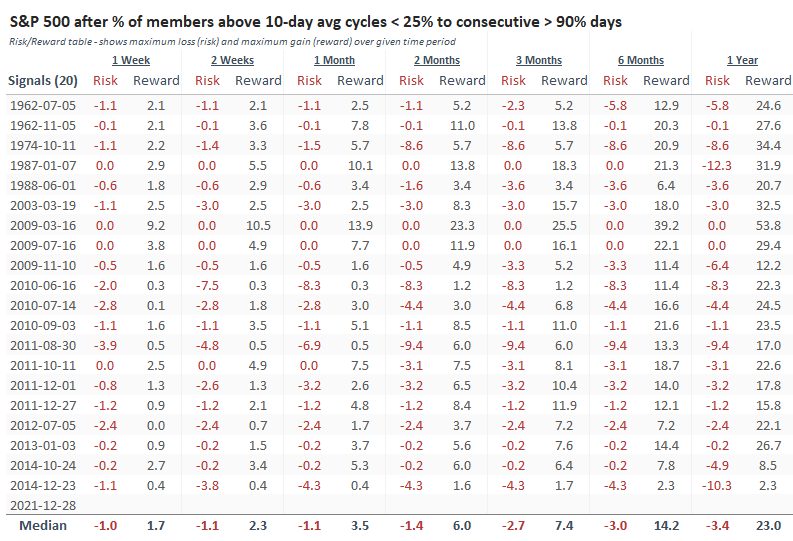
The Risk/Reward Table shows that over the next 6 months, there wasn't a single drawdown of more than -10% at any point after any of the signals. And 16 out of the 20 precedents showed a maximum gain of more than +10% during those 6 months.

A whole week of impressive trends

But it's even more impressive than that. By December 27, more than 90% of stocks were trading above their 10-day averages, and it hasn't dropped below 90% since then. This 5-day streak is tied for the 4th-longest since 1950.

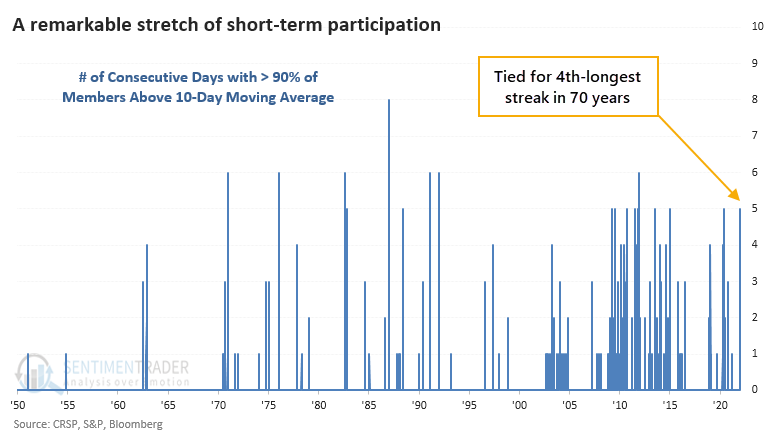
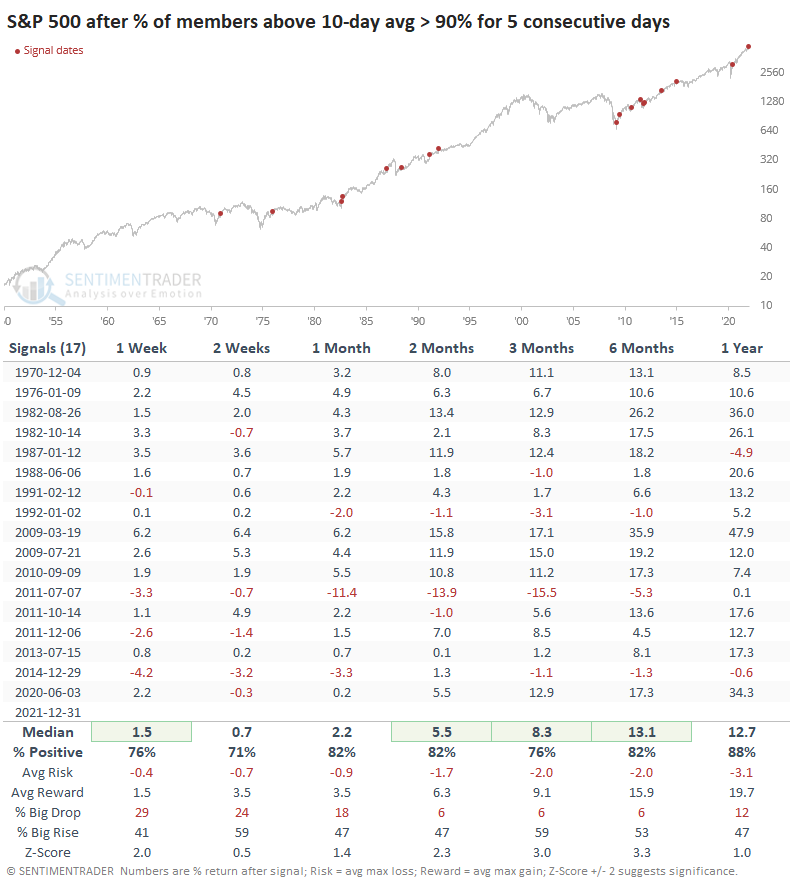
After other times when the S&P went 5 straight days with more than 90% of its members above their 10-day averages, the index continued to gain in the months ahead with few (and temporary) exceptions.

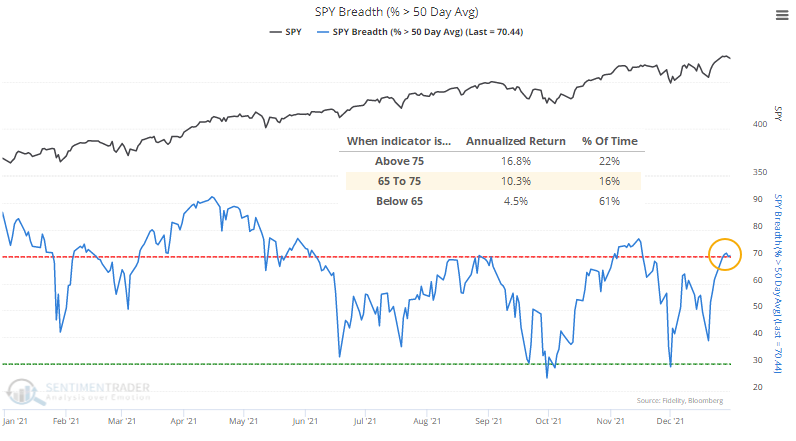
Longer-term participation is "just right"

Looking at longer-term breadth metrics for the S&P 500, most of them are in the not-too-hot-not-too-cold zone. About 70% of stocks are trading above their 50-day averages, which since 1928 has given an annualized return of 10.3%.

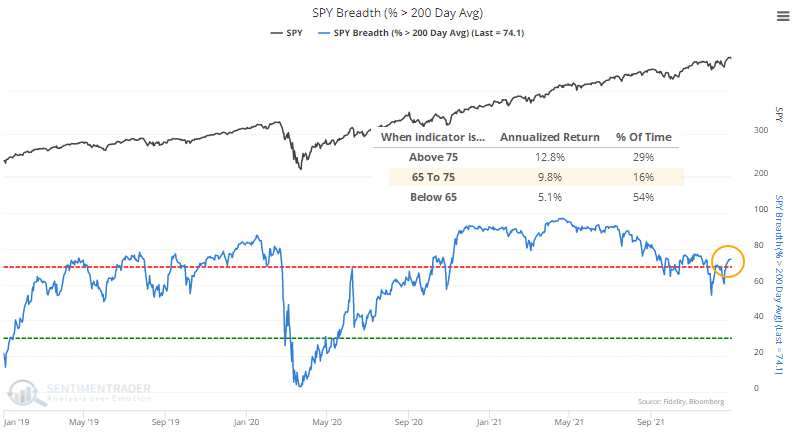
Just less than 75% of them are trading above their 200-day averages, which has also preceded annualized returns of about 10%.

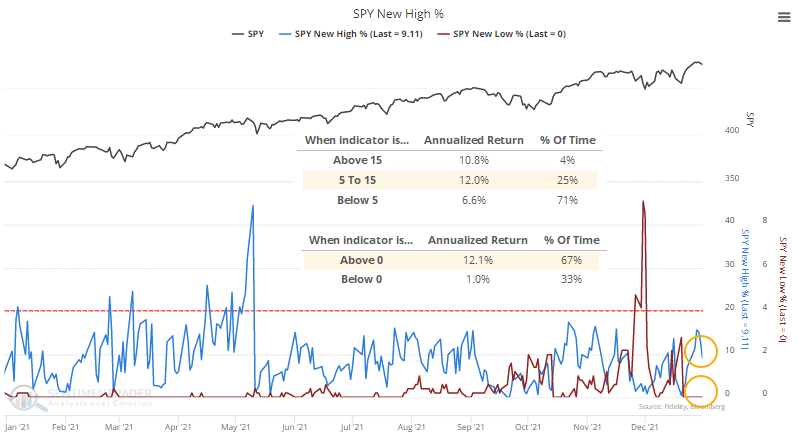
When the net percentage of stocks at 52-week highs minus 52-week lows is between 5% - 15%, as it is now, the index's annualized return bumped up to 12%. Actually, one of the most important aspects of this particular data set is simply whether there are more highs than lows. When lows dominate, the S&P's next-day return sinks dramatically, at least until there is a sudden surge that indicates capitulation.

What the research tells us...

There are definite concerns regarding valuations, bubble-like behavior in various assets, and a looming change in monetary policy. So far, equity investors don't seem to care, at least when it comes to blue-chip stocks. When we see sustained thrusts in short-term positive trends among members of the S&P 500, as we did at the end of December, it has preceded further gains almost without exception.

Sorry, you don't have access to this report

Upgrade your subscription plan to get access
Go to Dasboard
DATA &
TECHnologies
IndicatorEdge
‍
BackTestEdge
‍
Other Tools
‍
DataEdge API
RESEARCH
reports
Research Solution
‍
Reports Library
‍
actionable
Strategies
Trading Strategies
‍
Smart Stock Scanner
‍
FREE
RESOUrCES
Simple Backtest
Calculator
Simple Seasonality
Calculator
The Kelly Criterion
Calculator
Sentiment Geo Map
‍
Public Research Reports
‍
Free Webinar
COMPANY
‍
About
‍
Meet our Team
‍
In the News
‍
Testimonials
‍
Client Success Stories
Pricing
Bundle pricing
‍
Announcements
‍
FAQ
© 2024 Sundial Capital Research Inc. All rights reserved.
Setsail Marketing
TermsPrivacyAffiliate Program
Risk Disclosure: Futures and forex trading contains substantial risk and is not for every investor. An investor could potentially lose all or more than the initial investment. Risk capital is money that can be lost without jeopardizing ones’ financial security or life style. Only risk capital should be used for trading and only those with sufficient risk capital should consider trading. Past performance is not necessarily indicative of future results.

Hypothetical Performance Disclosure: Hypothetical performance results have many inherent limitations, some of which are described below. No representation is being made that any account will or is likely to achieve profits or losses similar to those shown; in fact, there are frequently sharp differences between hypothetical performance results and the actual results subsequently achieved by any particular trading program. One of the limitations of hypothetical performance results is that they are generally prepared with the benefit of hindsight. In addition, hypothetical trading does not involve financial risk, and no hypothetical trading record can completely account for the impact of financial risk of actual trading. for example, the ability to withstand losses or to adhere to a particular trading program in spite of trading losses are material points which can also adversely affect actual trading results. There are numerous other factors related to the markets in general or to the implementation of any specific trading program which cannot be fully accounted for in the preparation of hypothetical performance results and all which can adversely affect trading results.

Testimonial Disclosure: Testimonials appearing on this website may not be representative of other clients or customers and is not a guarantee of future performance or success.