Data &
Technology
Research
Reports
Report Solutions
Reports Library
Actionable
Strategies
Free
Resources
Simple Backtest Calculator
Simple Seasonality Calculator
The Kelly Criterion Calculator
Sentiment Geo Map
Public Research Reports
Free Webinar
Pricing
Company
About
Meet Our Team
In the News
Testimonials
Client Success Stories
Contact
Log inLoginSign up
< BACK TO ALL REPORTS

A Week with no Worries Whatsoever

Jason Goepfert
2021-06-17
For one of the few times in more than 20 years, we've gone a full week with not one of our core indicators showing excessive pessimism.

Last March, more than half of our core indicators were showing extreme pessimism. That's the kind of lopsided sentiment that has reliably coincided with the final "puke" phase of a decline, like the Christmas panic of 2018.

My how times have changed.

Over the past year, the few minor selloffs we've seen have pushed no more than 18% of indicators into pessimistic territory. And for the past week, there has not been a single one of our core indicators showing pessimism.

Indicators showing pessimism

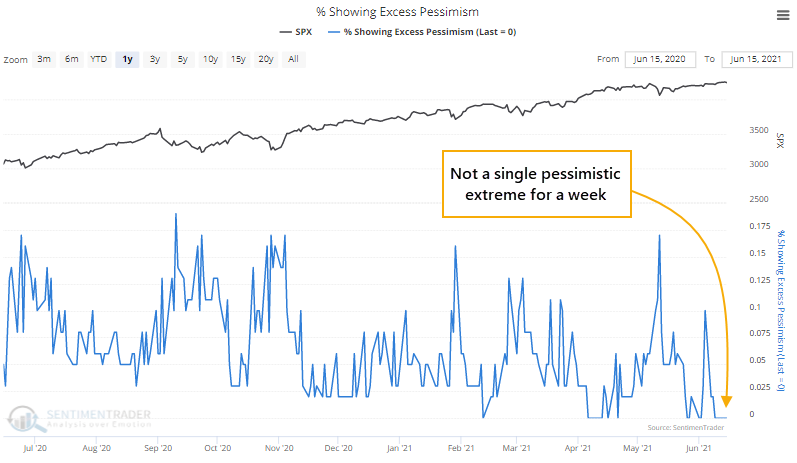
It's been rare to see an entire week go by without even one indicator sliding into extreme territory. The longest streak was 8 days, but before 2009, there wasn't a streak of even 5 days. 

The handful of times we went a week without a pessimistic extreme, the S&P 500 wasn't able to sustain its gains much longer.

Not only have there been no indicators showing pessimism, but 45% or more indicators have been showing extreme optimism. That has pushed the 10-day average of the spread between them to one of the highest levels in 5 years.

What else we're looking at

  • What happened to the S&P after other weeks with no pessimism
  • Returns following times when optimistic indicators far outpaced pessimistic ones
  • A current look at gold
  • A timing system for the equal-weight vs. capitalization-weight S&P 500 index


Stat box

Wednesday was only the 5th time that stocks, inflation-linked bonds, and gold all fell at least 0.5% the day of a Federal Reserve interest rate announcement. Of the three, gold suffered the worst in the short term after the other four instances.

Etcetera

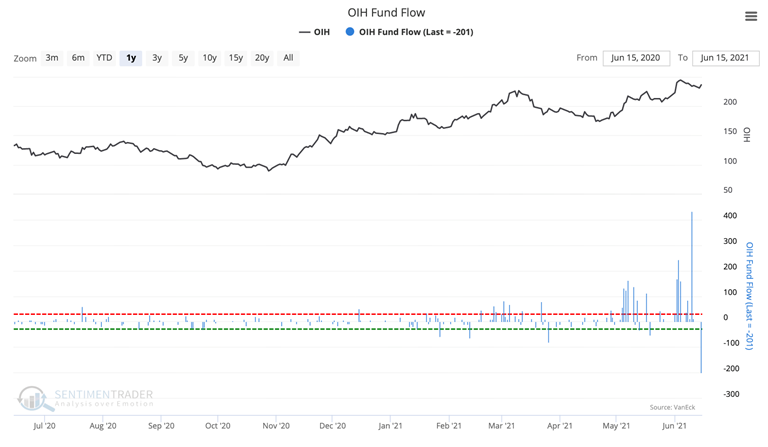
Give and take. Last week, the OIH Fund Flow reached an all-time high with a $432 million inflow. Then more than $200 million was withdrawn from the fund, a big turnaround from only a few days ago.

oih oil services fund flow

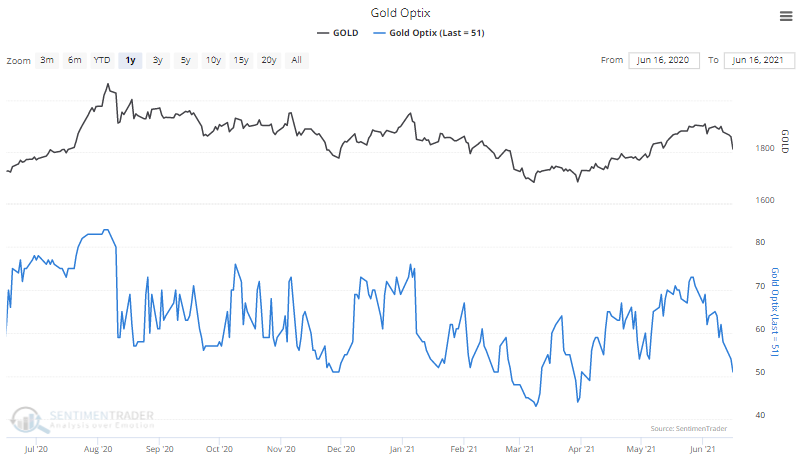
It's test time. Our Optimism Index for gold has plunged in recent days. It's nearing neutral, a "reset" threshold that has pulled in buyers every time over the past year. Watch for a change in character.

gold sentiment

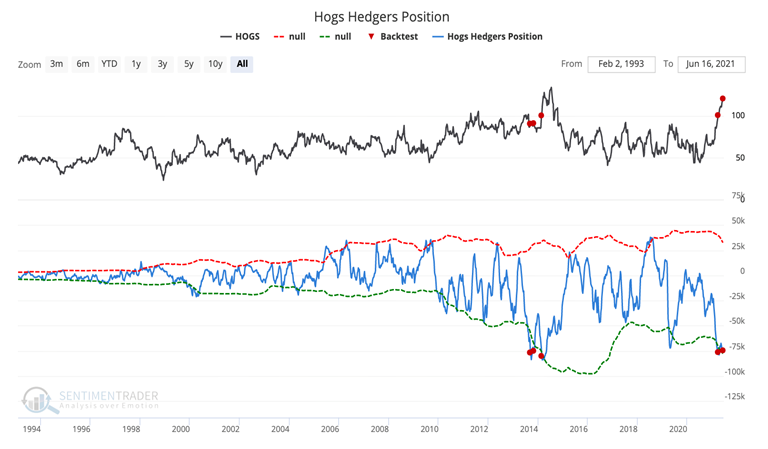
Hog wild. The Hogs Hedgers Position has reached its third-lowest point ever, bottoming at -74,598 contracts. Using our Backtest Engine, we can see that when this indicator crossed below -74k, one month later, hog prices were higher three out of four times. "Smart money" traders are selling heavily, but hogs prices usually don't fall until after hedgers start to reverse their outlook.

hog futures sentiment

DATA &
TECHnologies
IndicatorEdge
‍
BackTestEdge
‍
Other Tools
‍
DataEdge API
RESEARCH
reports
Research Solution
‍
Reports Library
‍
actionable
Strategies
Trading Strategies
‍
Smart Stock Scanner
‍
FREE
RESOUrCES
Simple Backtest
Calculator
Simple Seasonality
Calculator
The Kelly Criterion
Calculator
Sentiment Geo Map
‍
Public Research Reports
‍
Free Webinar
COMPANY
‍
About
‍
Meet our Team
‍
In the News
‍
Testimonials
‍
Client Success Stories
Pricing
Bundle pricing
‍
Announcements
‍
FAQ
© 2024 Sundial Capital Research Inc. All rights reserved.
Setsail Marketing
TermsPrivacyAffiliate Program
Risk Disclosure: Futures and forex trading contains substantial risk and is not for every investor. An investor could potentially lose all or more than the initial investment. Risk capital is money that can be lost without jeopardizing ones’ financial security or life style. Only risk capital should be used for trading and only those with sufficient risk capital should consider trading. Past performance is not necessarily indicative of future results.

Hypothetical Performance Disclosure: Hypothetical performance results have many inherent limitations, some of which are described below. No representation is being made that any account will or is likely to achieve profits or losses similar to those shown; in fact, there are frequently sharp differences between hypothetical performance results and the actual results subsequently achieved by any particular trading program. One of the limitations of hypothetical performance results is that they are generally prepared with the benefit of hindsight. In addition, hypothetical trading does not involve financial risk, and no hypothetical trading record can completely account for the impact of financial risk of actual trading. for example, the ability to withstand losses or to adhere to a particular trading program in spite of trading losses are material points which can also adversely affect actual trading results. There are numerous other factors related to the markets in general or to the implementation of any specific trading program which cannot be fully accounted for in the preparation of hypothetical performance results and all which can adversely affect trading results.

Testimonial Disclosure: Testimonials appearing on this website may not be representative of other clients or customers and is not a guarantee of future performance or success.