A Week with No Pessimism
Last March, more than half of our core indicators were showing extreme pessimism. That's the kind of lopsided sentiment that has reliably coincided with the final "puke" phase of a decline, like the Christmas panic of 2018.
My how times have changed.
Over the past year, the few minor selloffs we've seen have pushed no more than 18% of indicators into pessimistic territory. And for the past week, there has not been a single one of our core indicators showing pessimism.
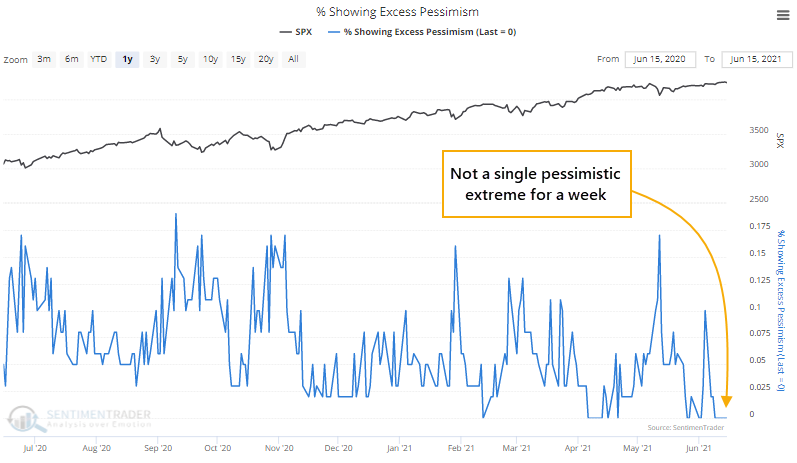
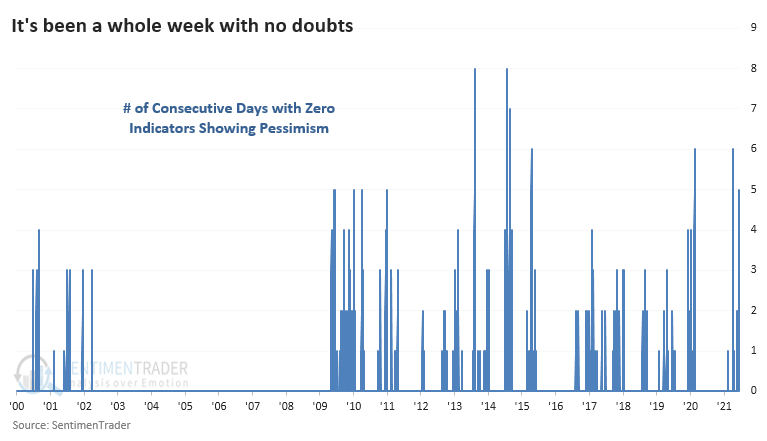
It's been rare to see an entire week go by without even one indicator sliding into extreme territory. The longest streak was 8 days, but prior to 2009, there wasn't a streak of even 5 days.
A SHORT-TERM WARNING
The handful of times we went a week without a pessimistic extreme, the S&P 500 wasn't able to sustain its gains much longer.
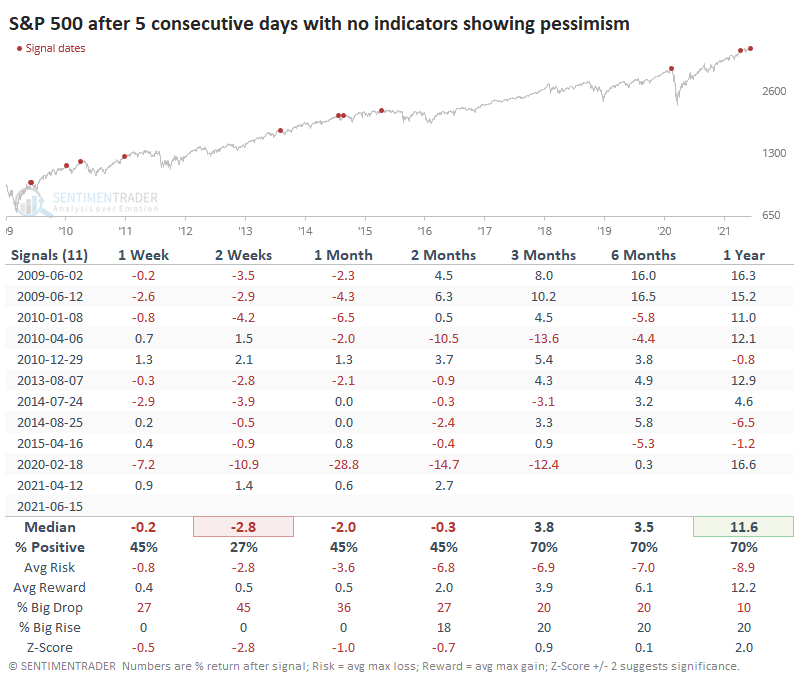
Out of the 11 precedents, 9 showed a negative return either 2 or 4 weeks later, and one of the exceptions was barely positive. The other preceded minor gains that were ultimately erased. Not impressive.
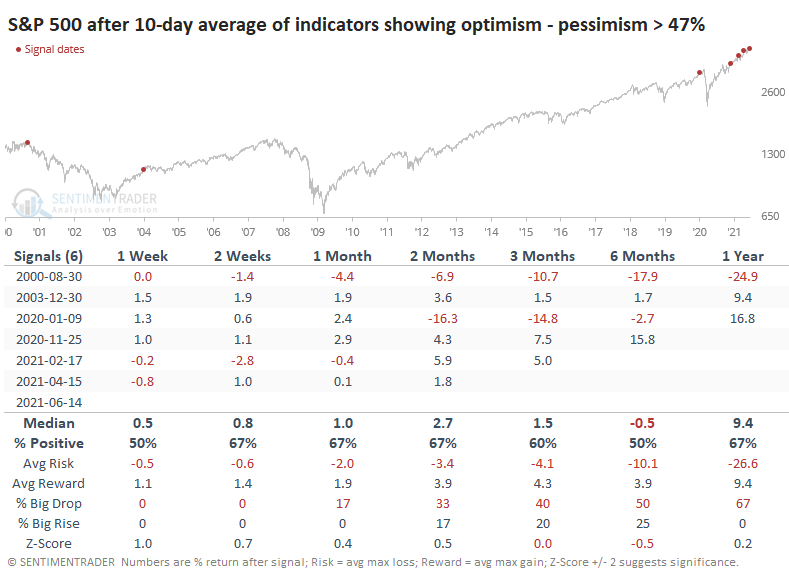
Not only have there been no indicators showing pessimism, but 45% or more indicators have been showing extreme optimism. That has pushed the 10-day average of the spread between them to one of the highest levels in 5 years.
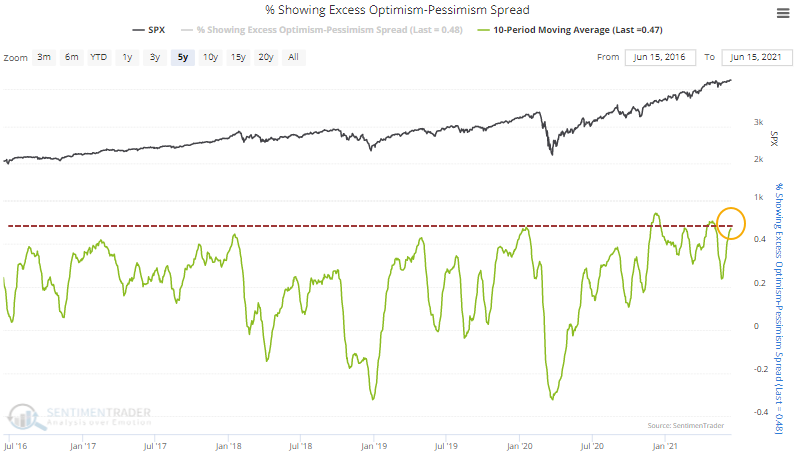
Since we began tabulating these measures over 20 years ago, there have been only a few times when the 10-day average of the spread has reached its current level.
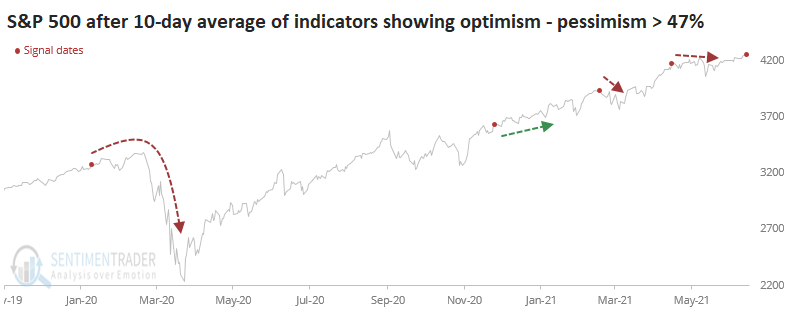
If we zoom in on the past 18 months or so, we can see that one signal preceded the covid crash, one preceded nothing but continued upside (from November 2020), and the other two saw the S&P chop lower for weeks before resuming the rally.
The rally in stocks has been incessant since November, and we're once again seeing a spurt of speculative excess along with some minor deterioration under the surface. It hasn't been enough to trigger any major warning signs but it bears watching given the new round of extremes in many indicators.

