
A week for the ages

There were so many notable developments last week that it didn't fit well with a regular report, so below we highlight the ones that popped up on our radar. Instead of Troy's usual premium weekend recap, he contributed to this post and I've noted his contributions with [TROY].
There are 3 basic parts:
- The price plunge within the context of where it originated
- Wholesale selling pressure during the week
- How it impacted sentiment
The overall impression is this:
When we've seen price moves like this, with similar amounts of wholesale selling pressure, there was a very strong - almost universal - tendency to see rebounds over the next 2-3 months. That does not preclude violent shorter-term moves in both directions, and it does not preclude an eventual slide into a bear market. But even in those cases, stocks had a consistent tendency to recover in the month(s) ahead before rolling over.
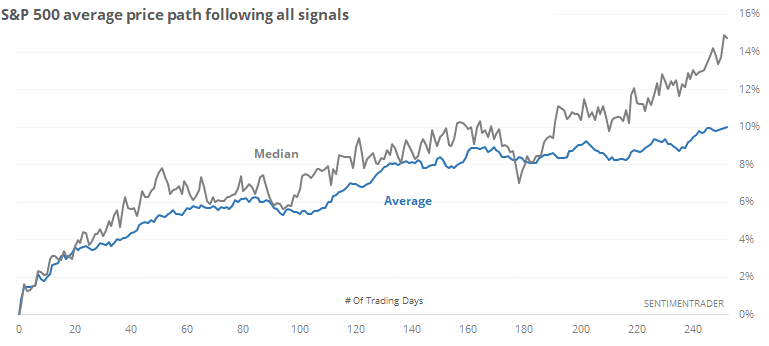
When we aggregate all the signal dates in all the tables below, then we get the following price path for the S&P 500 going forward. There was about a 5% gain over the next couple of months before the signals started to diverge more among themselves.
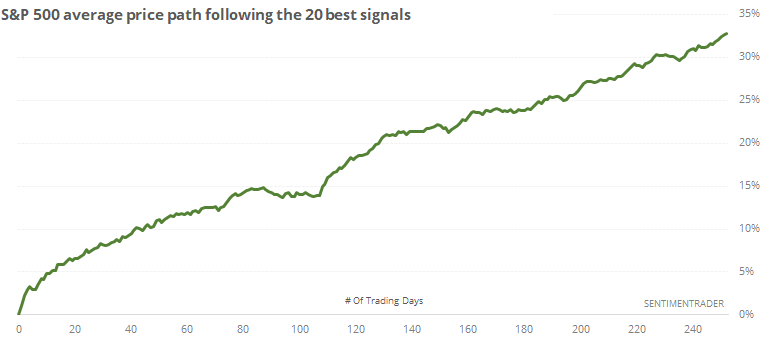
Because there were so many signals, there was quite a difference between the best and worst ones. The top 20 signals tended to jump higher immediately and see consistent gains over the next four months at least.
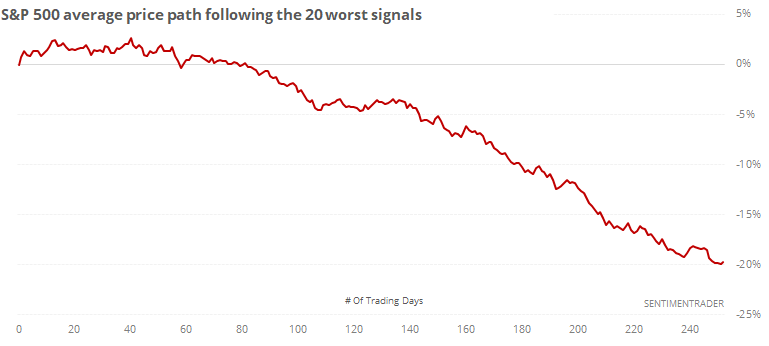
The 20 worst signals (the ones with the worst 1-year returns), also did okay during the first month or two, then fell apart after that. Many of these were in 2008 and 2001.
1. THE PRICE PLUNGE
Quick correction
We saw on Thursday how this was one of the quickest pullbacks of more than 5%. It went well beyond that, of course, with a more than 10% correction. More than half the days saw an opening gap of more than -1%, and when combined with the magnitude of the losses, only October-November 2008 can compare.
Within a month of an all-time high, the S&P falling into a correction has happened 6 other times.
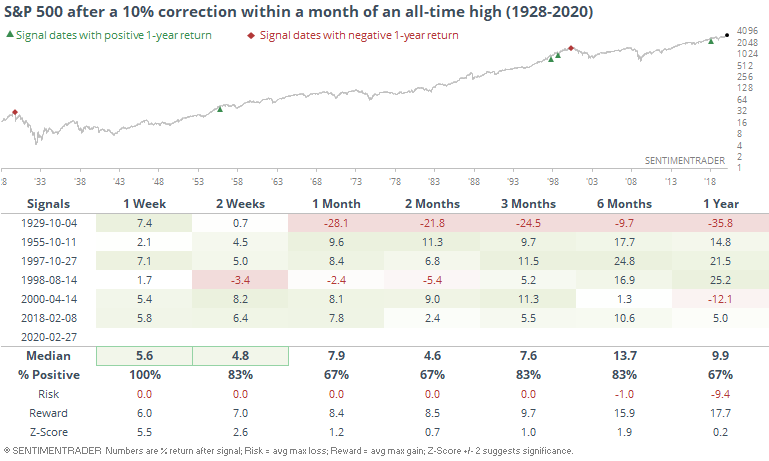
Two of those turned into bear markets, but the 2000 one took a long time to play out, and the S&P rallied more than 11% over the next three months.
Since the S&P fell into a correction, it makes sense that most of its stocks did, too. More than 90% of them are now 10% below their highs for the first time since December 2018.
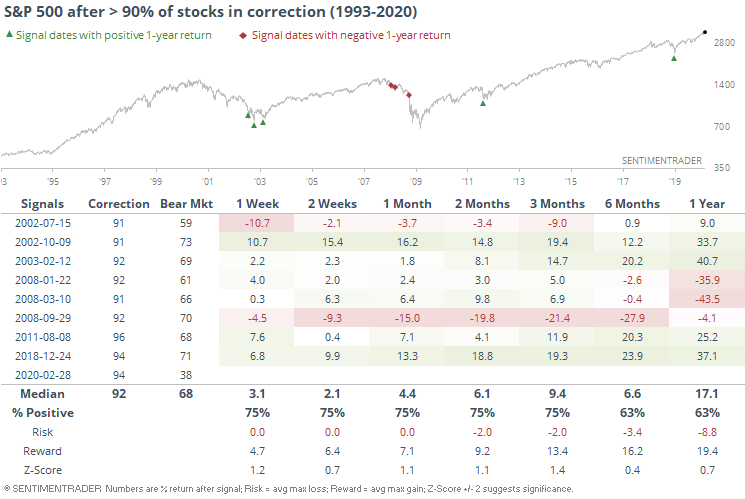
Notably, this is - by far - the signal with the fewest % of stocks in bear markets. Not sure if that's a good thing (healthy market) or a bad one (more room to fall) since there aren't any precedents. Typically when we see something like this, it's more of a good sign than bad one.
Gains wiped out
We noted earlier how this is one of the fastest times the S&P has ever cycled from a new high to at least a 4-month low. The other two led to immediate rebounds, for what that's worth.
If we relax the parameters to see how robust this is, then the implications were still very positive over the medium-term.
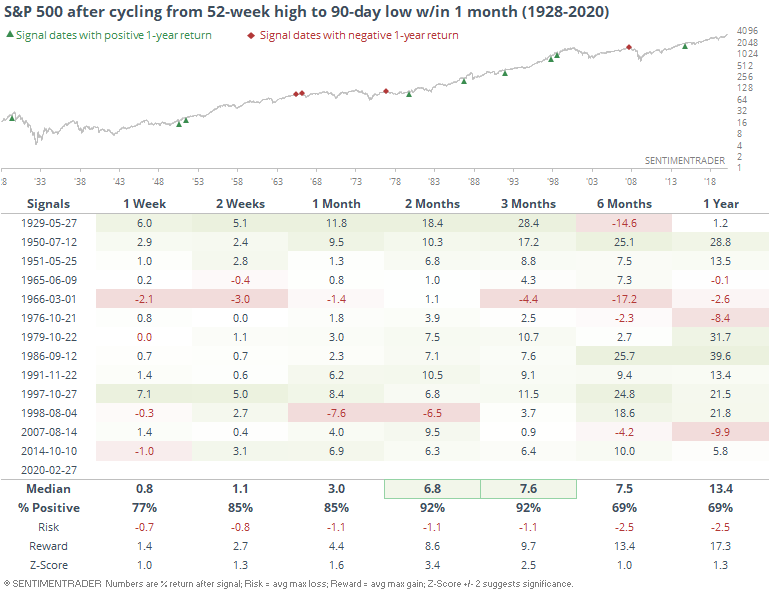
Of the 14 times the S&P has erased so many late buyers' gains so quickly, they stepped back in 13 times. The 1998 signal suffered some large losses over the next month, but those were subsequently made up over the next couple of months. Several of these ended up morphing into bear markets, but not until 6-12 months later.
Nasdaq holds up
It's also worth expanding another study from earlier. With its late recovery on Friday, the Nasdaq Composite remained the only one of the "big four" indexes to hold above its 200-day average while the other 3 all fell below theirs within the past month.
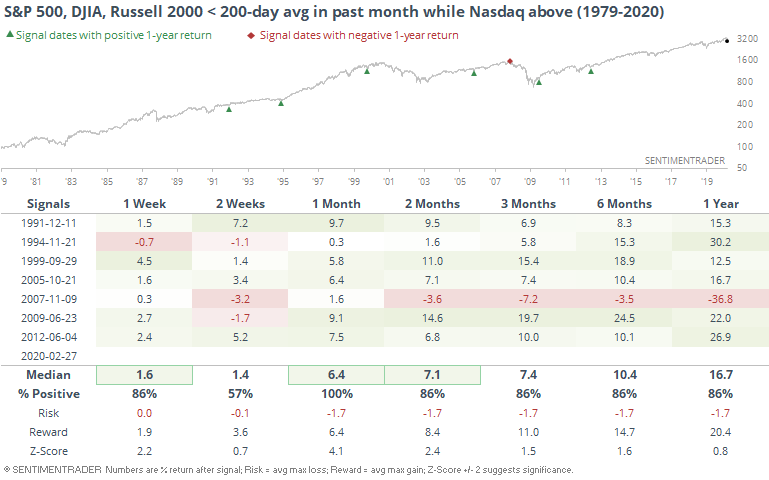
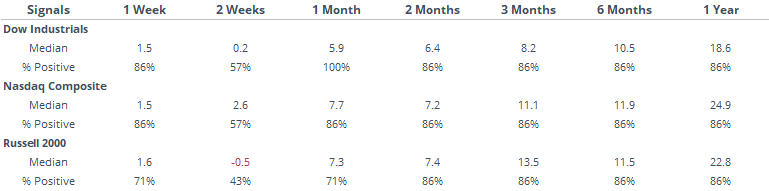
Among the other indexes, the Dow joined the S&P with a perfect record of bouncing back over the next month. The Russell lagged.
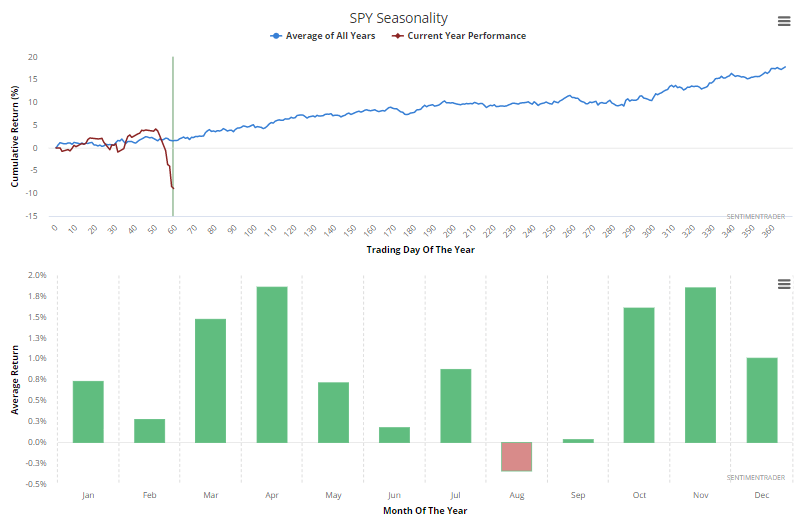
Time of year
The drop came during one of the weakest months of the year. Seasonality is always an iffy thing for stocks, but for what it's worth, the March/April stretch has been among the best over the past 30 or so years.
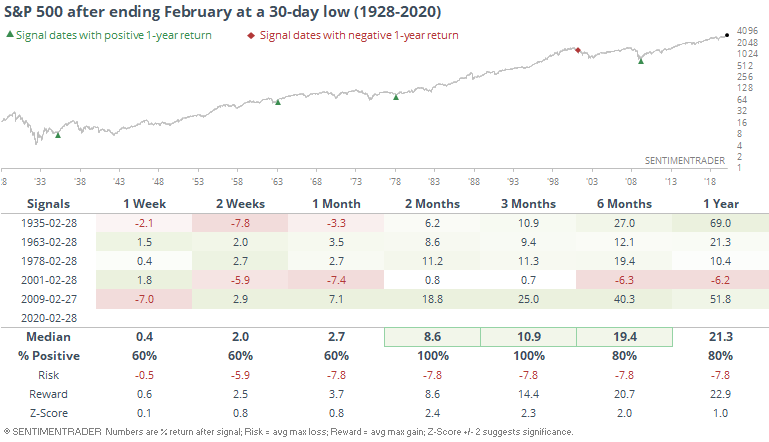
And when the S&P ended the month of February at even a 30-day low, it rebounded over the next 2-3 months.
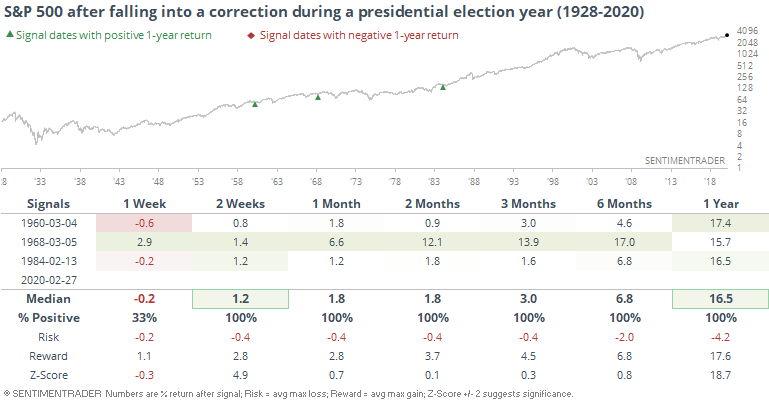
Presidential push
Our current president seems more likely than any other to do what he can to help the markets. Even so, a common theory over the decades has been that every president will do what they can to get re-elected, or help their party retain control. They have limited power, but can try to push through market- or economy-friendly policies in the year before election.
When it wasn't working, and stocks fell into correction territory during an election year, the market did rebound the few times it happened.
2. WHOLESALE SELLING PRESSURE
Worst breadth ever (or close to it)
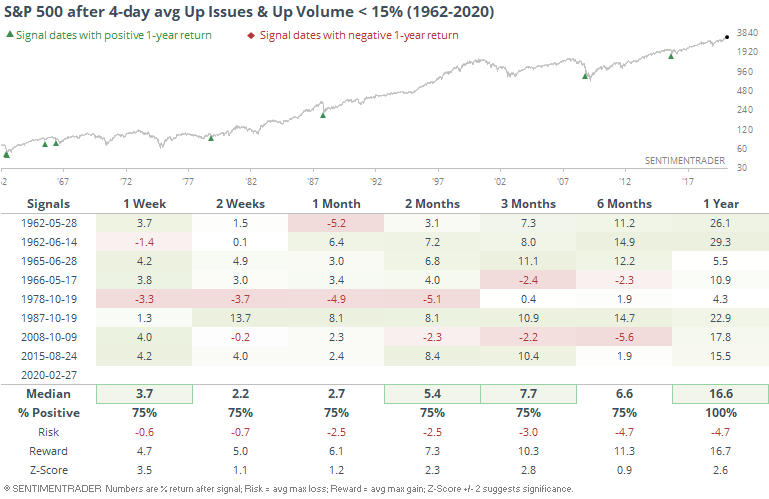
Breadth last week was among the worst we've ever seen. The four days through Thursday saw an average Up Issues and Up Volume ration on the NYSE that was the 4th-worst since 1962.
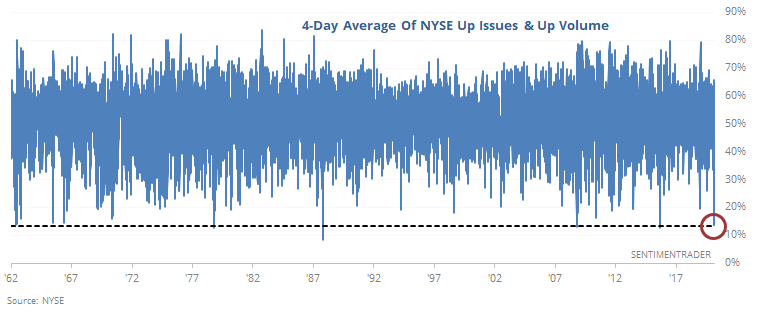
Any time the average was below 15%, it coincided with mostly exhaustive selling.
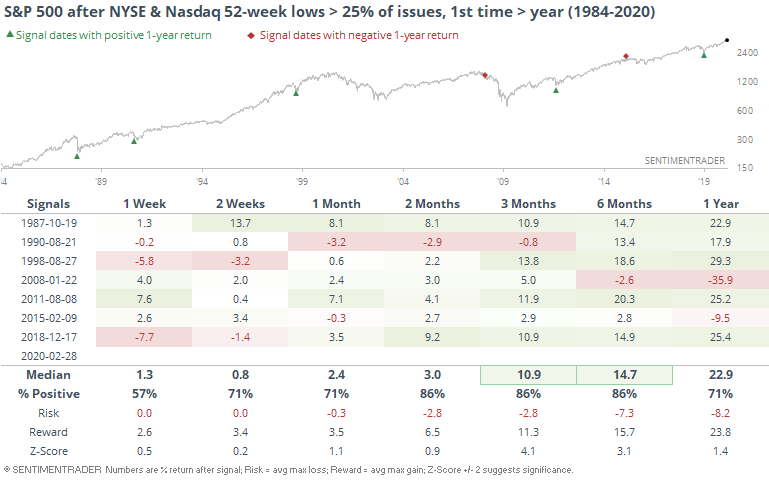
It was enough to drive an average of 25% of the securities on the NYSE and Nasdaq to 52-week lows. That's more than any other point over the past year.
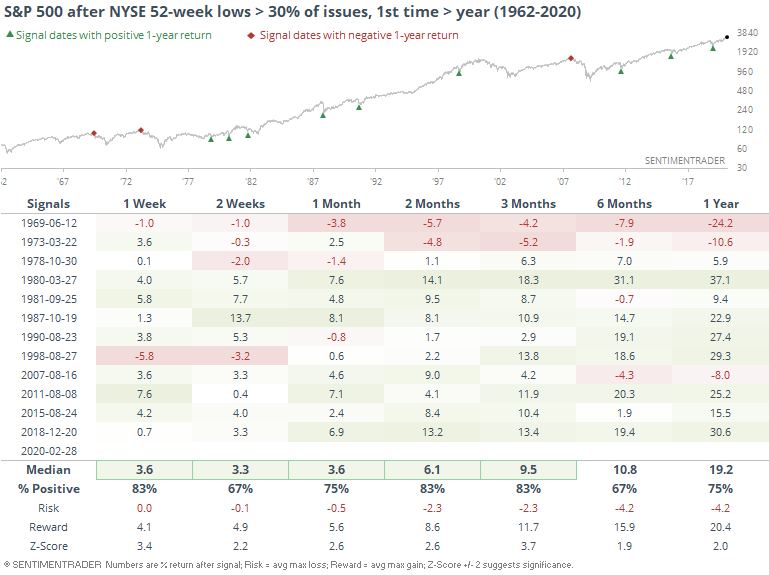
If we just restrict our look to the NYSE, it was more than 30% of total issues. When there was a spike in lows in 1969 and 1973, it preceded wicked declines. Other than that, not so much (it did in 2007, but with a long delay).
[TROY] Breadth momentum dive
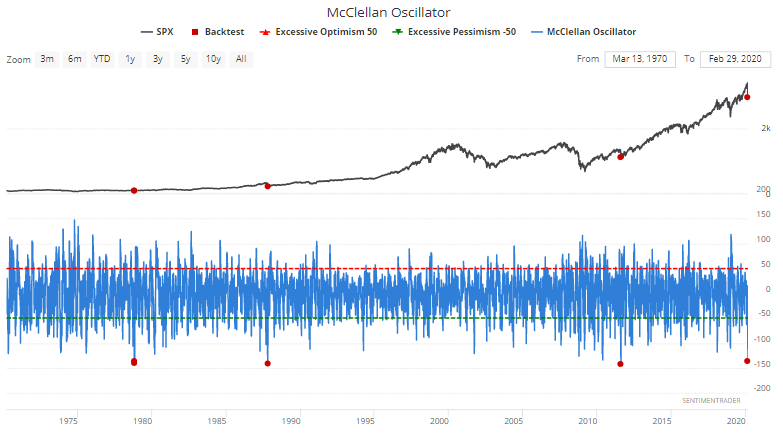
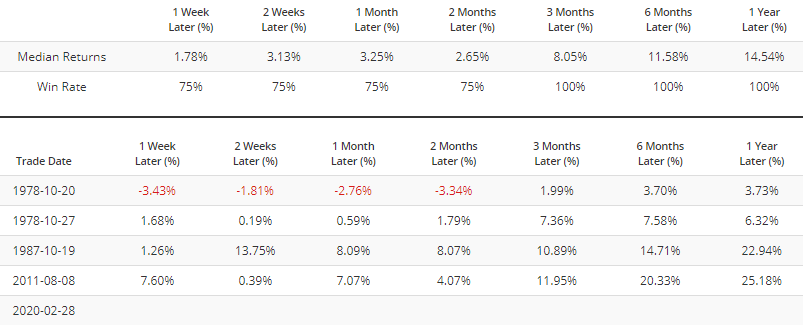
The McClellan Oscillator - a popular breadth indicator based on advancing vs. declining issues - is truly at an extreme. Such levels of selling have only been matched 3 other times in history:
- August 8, 2011: the bottom of a major -20% correction
- October 19, 1987: biggest one day crash in market history, near bottom of a massive correction
- October 20 and 27, 1978: towards the end of a -15% correction
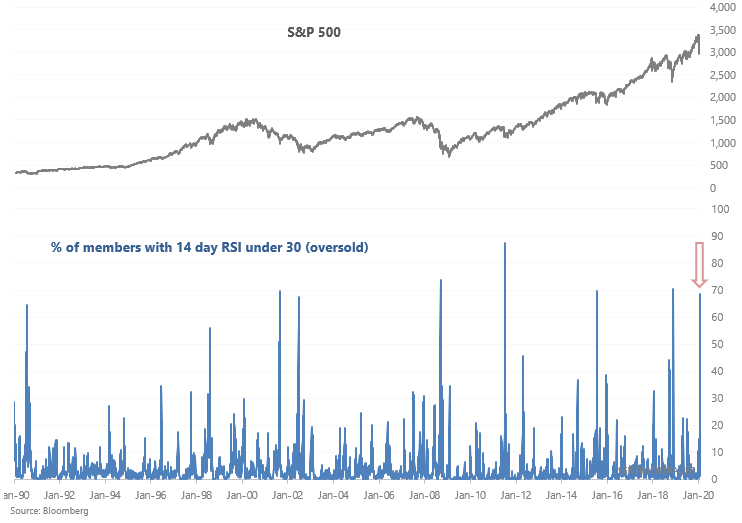
[TROY] Technical deterioration
Here's a quick update of various breadth charts that I covered on Friday. As you would expect, Friday's decline pushed most indicators to even more extreme levels. Here's the % of S&P 500 members that are oversold:
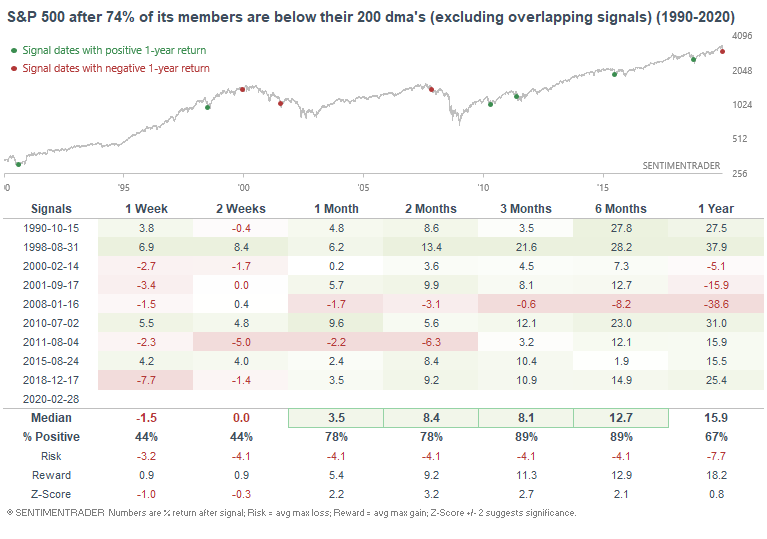
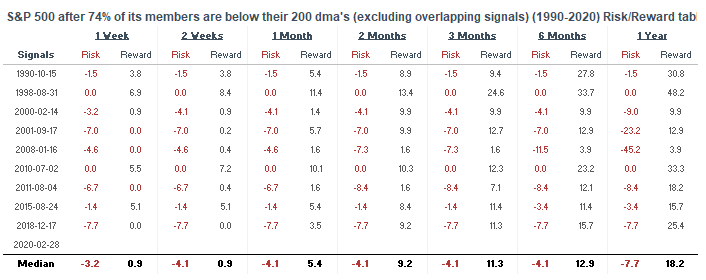
Here's the % of S&P 500 members that are below their 200 day moving averages:
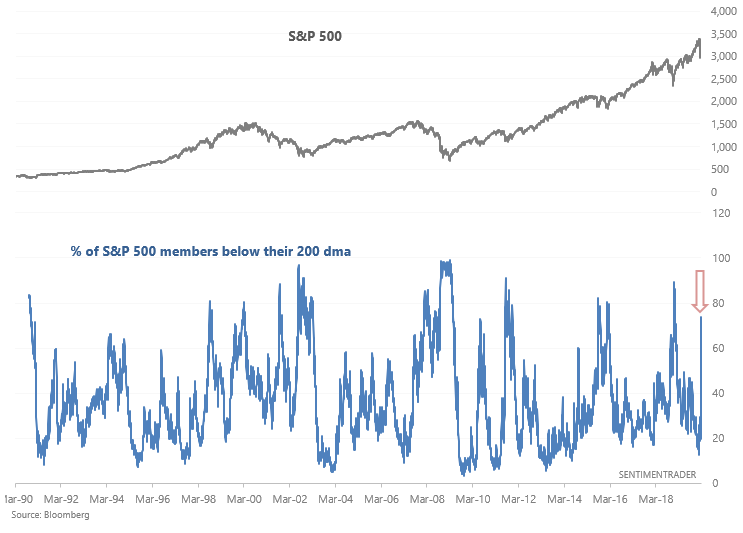
*This was usually bullish for the S&P over the next 3-6 months. The single biggest failure was in January 2008, just as a major bear market and recession began.
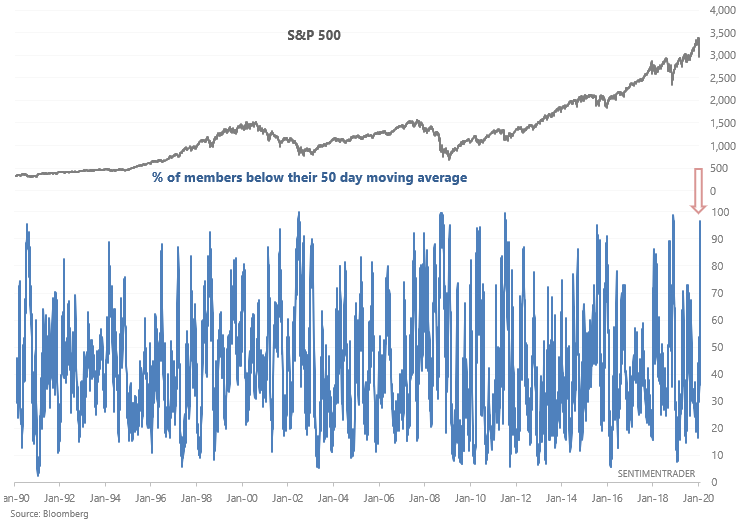
Here's the % of S&P 500 members below their 50 dma's (i.e. in a medium term downtrend):
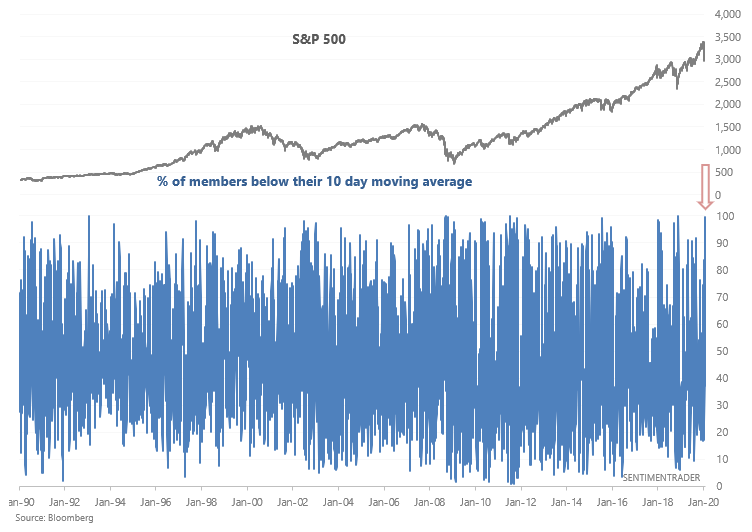
And here's the % of S&P 500 members below their 10 dma's (i.e. in a short term downtrend).
[TROY] Everything is being sold
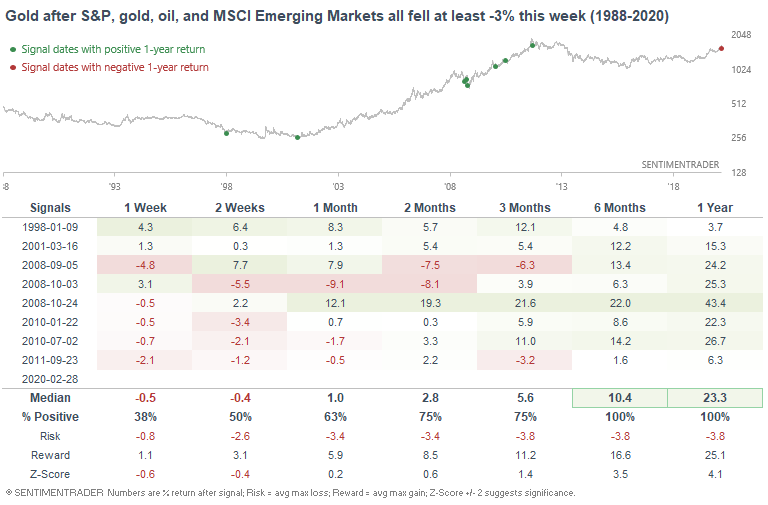
This week was brutal for global markets. U.S. equities, emerging markets, and many commodities tanked. Even gold, which some consider to be a safe haven, did not fare well. Such across-the-board selling has only occurred a few times since 1988. As you may guess, this typically happens around a bear market, recession, or major correction (1998, 2001, 2008, 2010):
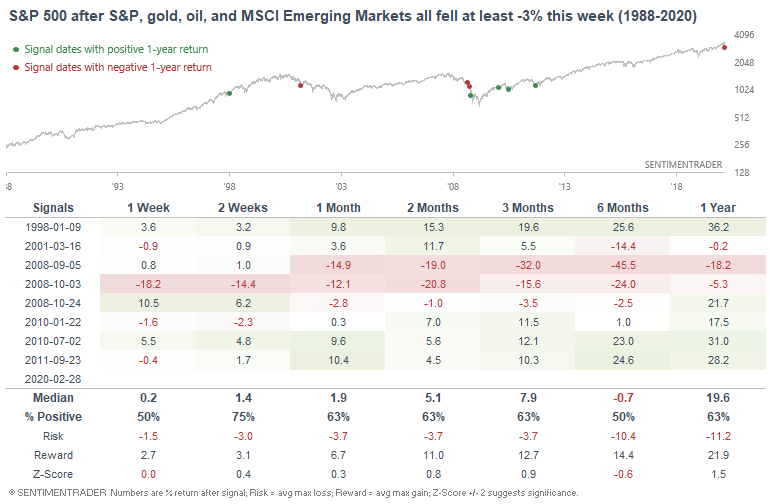
Excluding cases from the worst of the 2008 meltdown, the S&P 500's forward returns were mostly positive. Personally, I don't think today is comparable to 2008.
Could coronavirus tip the global economy into a recession? Perhaps. I don't know enough about it (it's better to not pretend to be an "expert" on everything). But if a recession did occur, it's hard to imagine that it will be as bad as the 2008 global financial meltdown. With that being said, gold's 6-12 month forward returns were bullish:
3. HOW IT IMPACTED SENTIMENT
Options traders
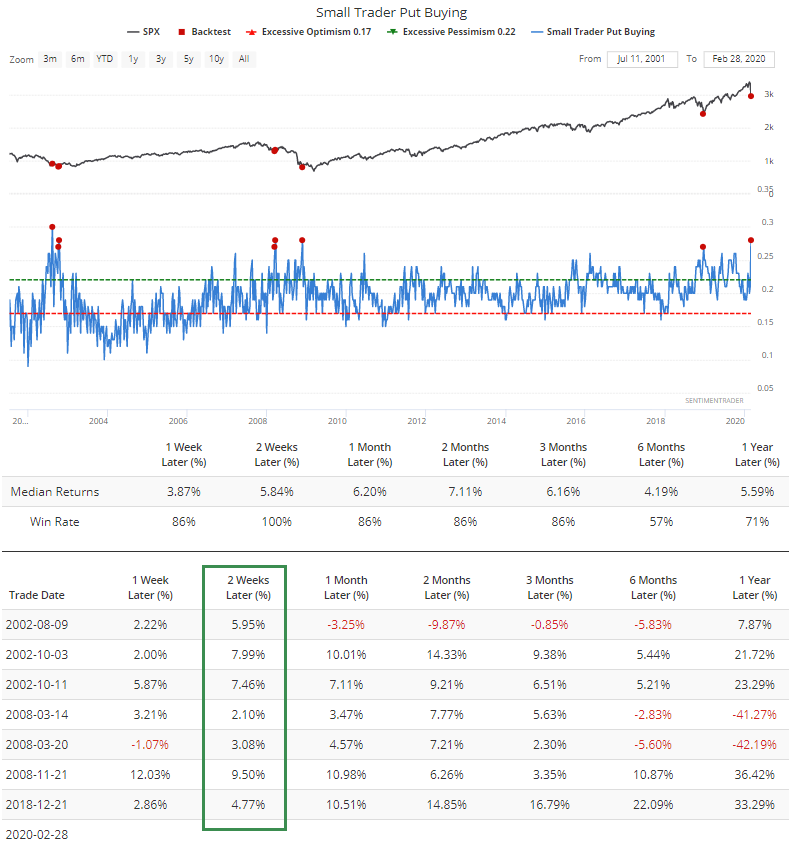
One of the biggest reasons for concern among the many that had been building into mid-February was the historic level of speculation among options traders, specifically the smallest (and theoretically most emotional) of them.
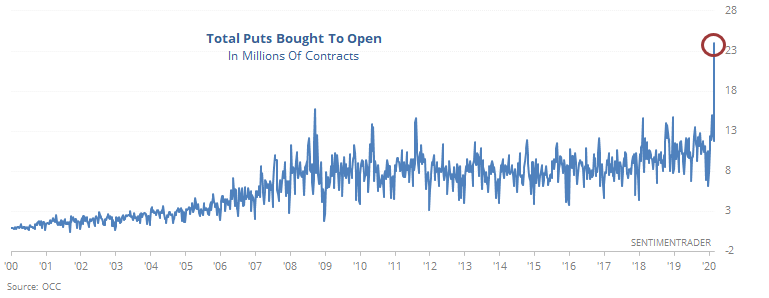
Over the prior month and a half, traders were buying a record number of speculative calls relative to protective puts. Last week put a big damper on that activity, as they bought more than 24 million put options to open, by far a record.
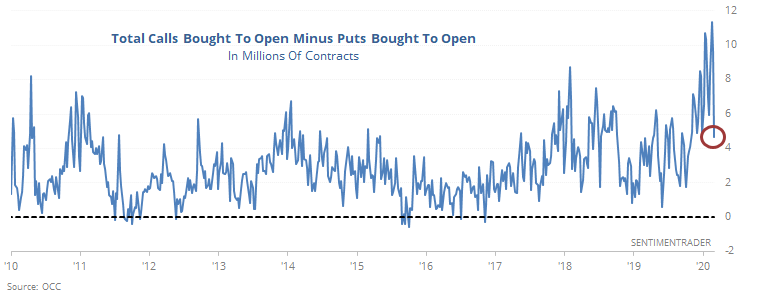
The problem? They also bought nearly 29 million call options, so there was still a net addition to speculative positions. This is distressing.
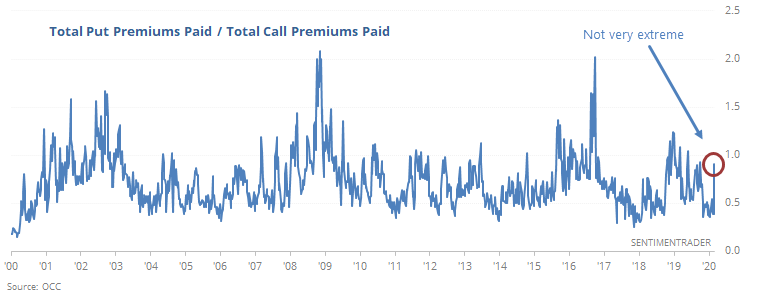
Because of a jump in volatility expectations, traders paid nearly as much for those put options as they did for the call options. That's high, but past periods of outright fear saw them paying twice as much for puts as they did for calls.
Looking specifically at the smallest of options traders, they did spend 28% of their volume on purchasing protective put options. That ranks among the most all-time.
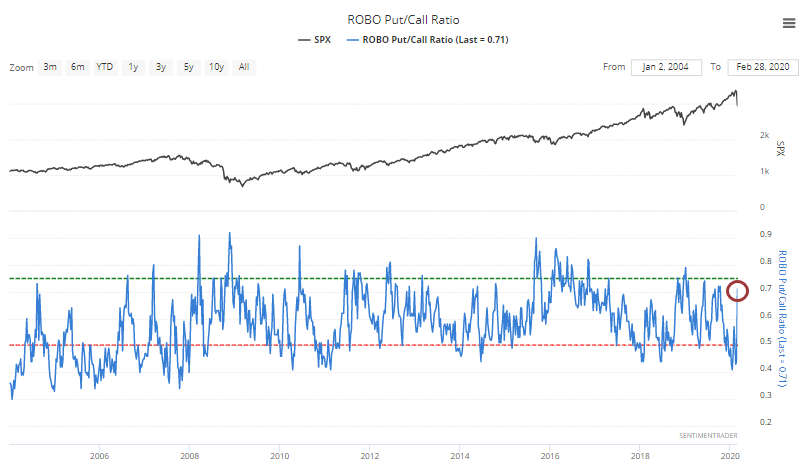
The issue is that each of those other weeks also saw them spend less than 35% of their volume buying speculative call options, and usually quite a bit less than that. But last week, they still spent nearly 40% of their volume on calls, so the ROBO Put/Call Ratio rose but not to an extreme level, which degrades the bullish implications of all that put buying.
This is weekly data, and stocks have essentially only declined for a week. So there hasn't been much time for traders to adjust the massive positions they'd built up. That would argue for a more drawn-out process of bottoming instead of the quick snap-backs we've been accustomed to.
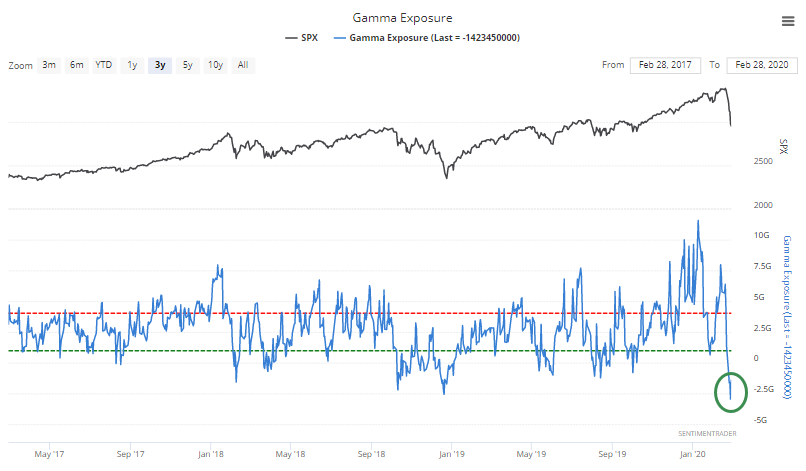
The sudden plunge in prices and jump in volatility has triggered a massive change in gamma exposure. Based on options positioning, this estimates how many shares need to be bought or sold as prices move for/against the positions. As of late last week, it's at a record, meaning traders would have to buy shares in order to reduce their overall exposure.
Volatility explosion
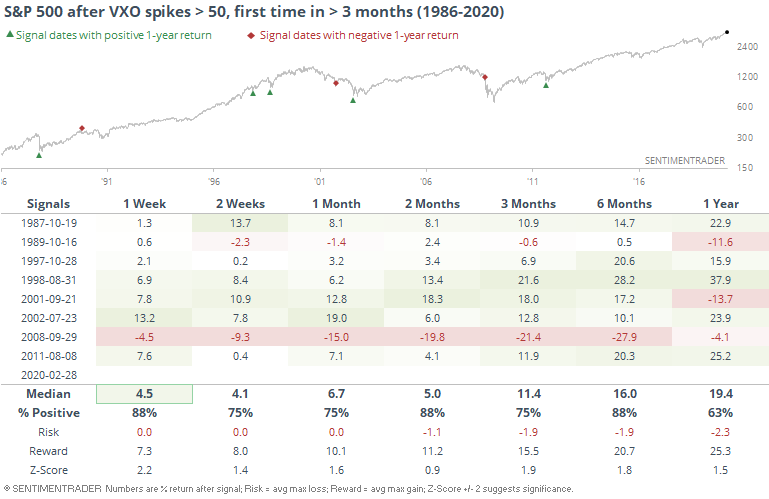
The lack of a bottom as the week dragged on caused more and more anxiety among options traders. The old VIX spiked above 50 for the first time in 2,152 sessions, ending its longest streak ever (the prior record was 2,028 sessions ending during the Asian economic crisis in October 1997.
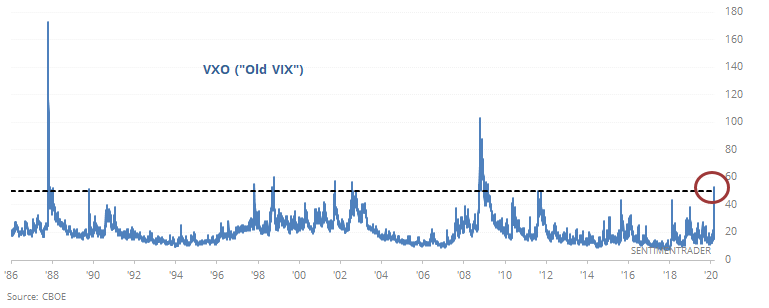
The chart would look a lot more impressive without 1987 distorting the scale. Regardless, outside of a painfully early signal in 2008, such high volatility expectations have rarely come to pass.
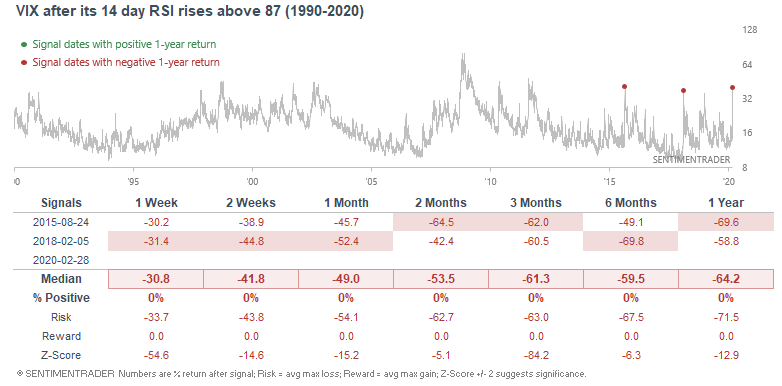
[TROY] VIX momentum
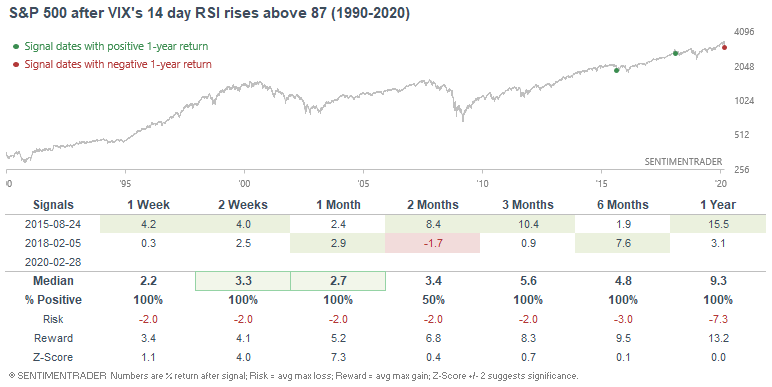
Without talking about VIX too much, its spike truly is historic. Its 14 day RSI has now reached 87, a level that was only matched 2 other times from 1990-present. Both cases saw VIX drop immediately....
And while it was short term bullish for the S&P 500, it did not necessarily mean that the S&P 500's bottom is in.
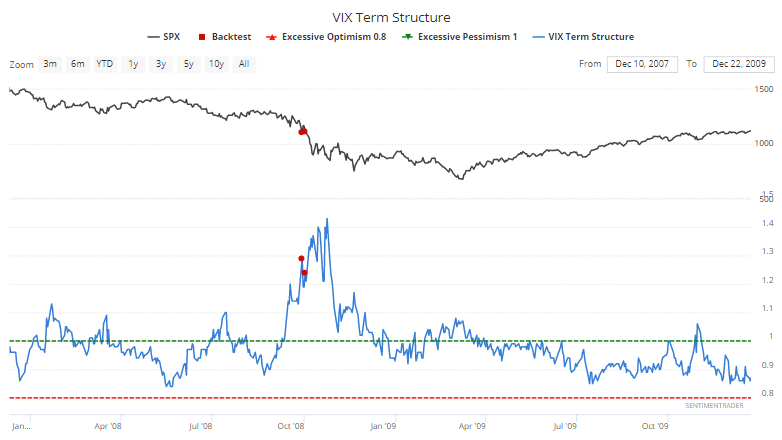
Inverted
That momentum in the VIX is mostly reflected mostly in the short end of VIX futures contracts, showing that traders are suddenly very nervous about immediate volatility. The Term Structure has severely inverted, which has been a decent signal for stocks over the past decade.
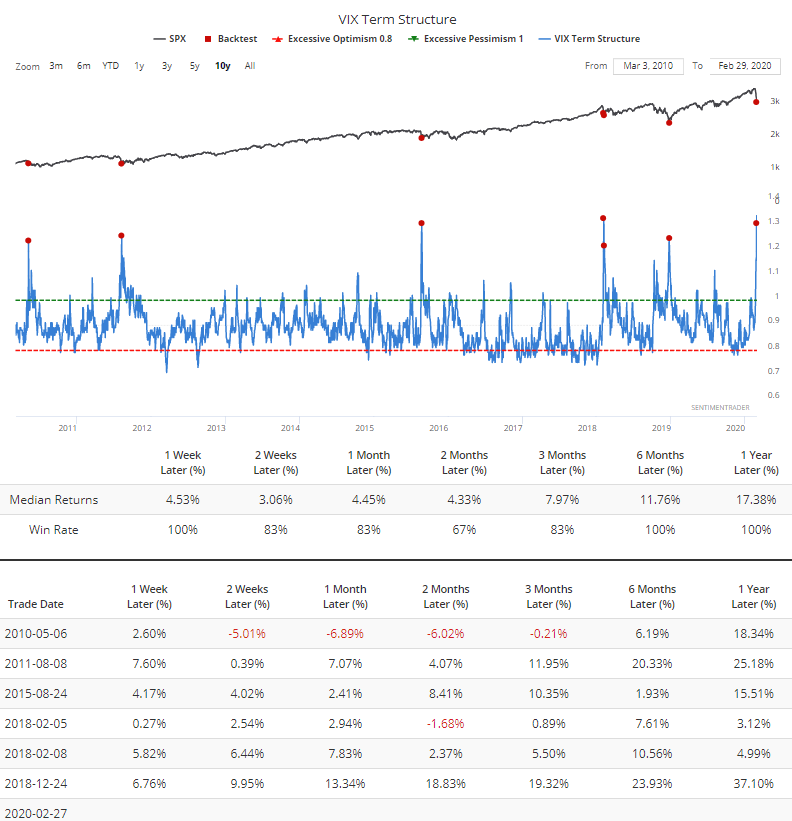
The only other time it got this inverted was in 2008, which proved to be way too early for a buy signal.
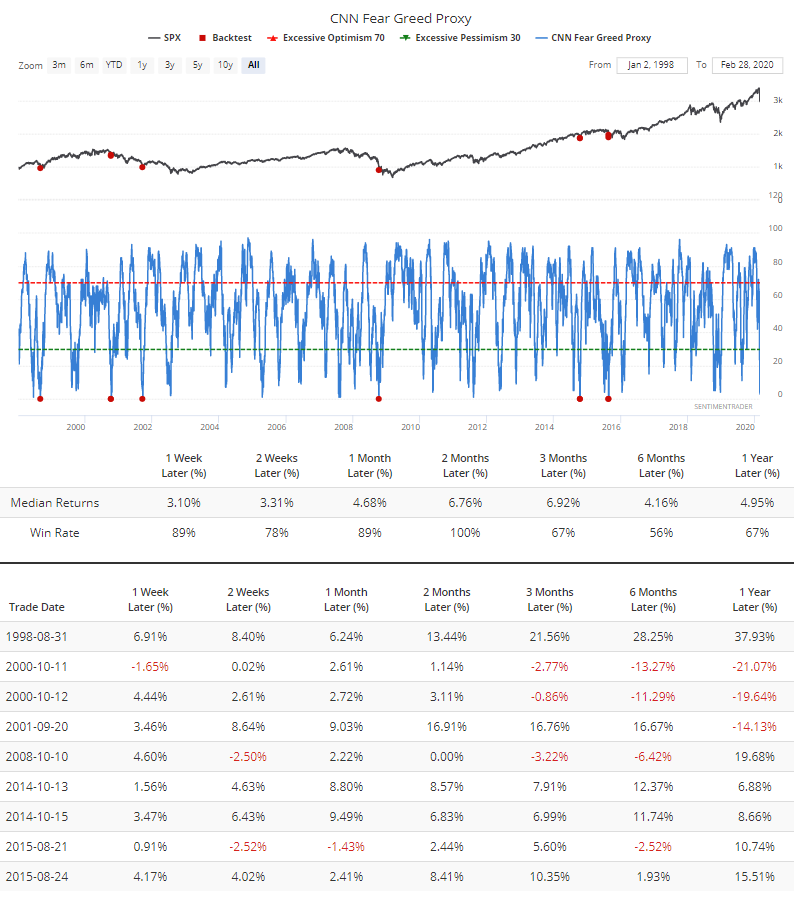
Maximum fear
Volatility expectations are part of the CNN Fear & Greed model. Our proxy of that model dropped to maximum pessimism on Friday with a reading of 0%. All the other times it dropped to zero, stocks rallied over the next two months according to the Backtest Engine.
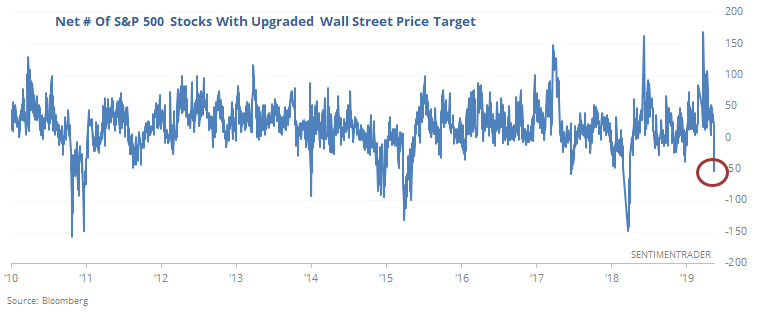
Wall Street gets nervous
Panic isn't isolated to individual investors. Institutional ones are just as - or more - likely to try to sell first because many of them have job security to worry about.
We can see some of that in the sudden rush to lower price targets among Wall Street analysts. In the January 29 report, we saw that they were raising price targets but not earnings estimates, as they got sucked into the "get me in now" attitude, regardless of fundamentals.
On Friday, they lowered the price target on a net 53 stocks in the S&P 500, the most in over a year.
There have been 73 days since 2010 when they lowered the estimates on so many stocks at the same time.
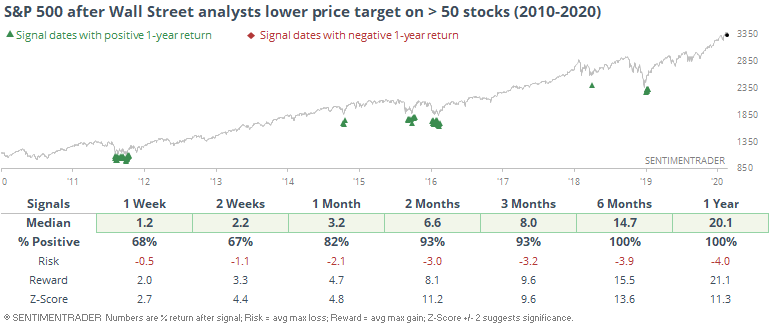
Granted, these all occurred within the context of a mostly roaring bull market, but even so the results were significantly better than random during the study period.
[TROY] Volume spike
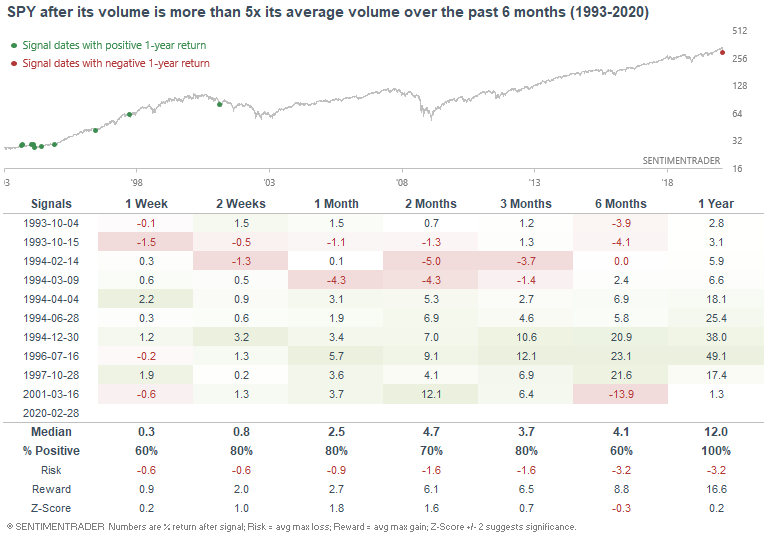
If there's one word that cannot describe this market, it's "dull". Stocks tanked after a monster rally over the past few months. Stock market crashes typically bring out a surge in volume, and this week was no exception. Friday's SPY volume was more than 5x the average of the past 6 months:
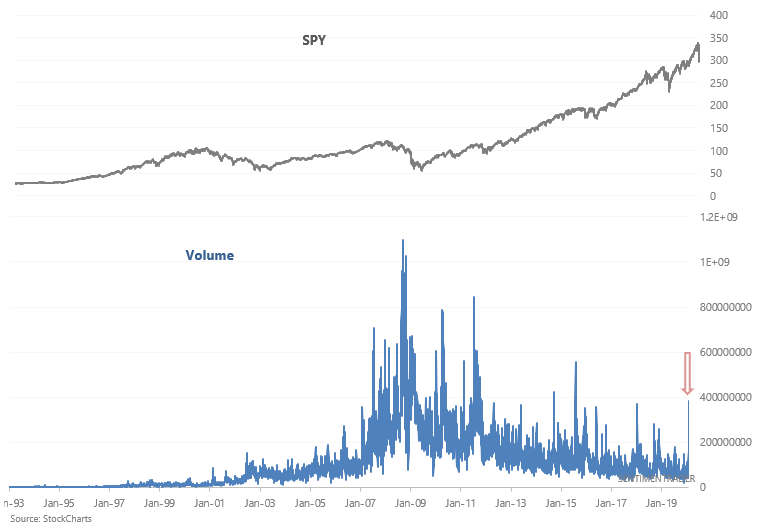
When volume spiked in the past, the S&P's returns over the next month were more bullish than random:
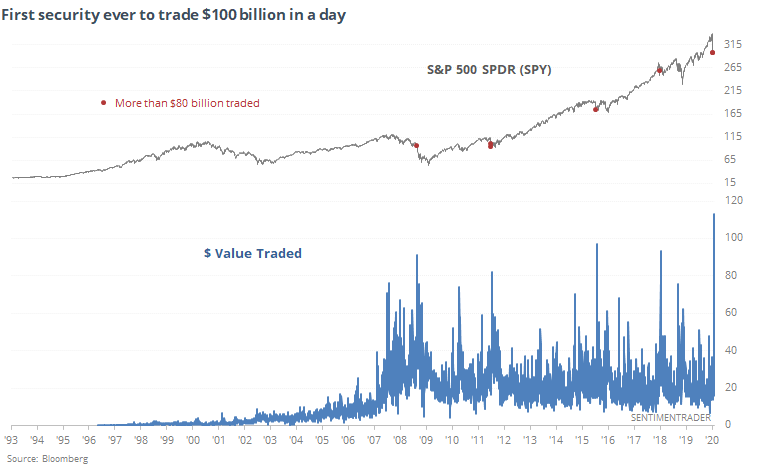
Liquid love
When traders become panicked, they gravitate toward the most liquid instruments. And nothing is more liquid than SPY. As noted by Bloomberg, SPY became the first security ever to trade more than $100 billion in a single session.
This is the concept behind the Liquidity Premium, based on the theory that during times of duress, traders will focus on ETFs as opposed to individual stocks. And now that premium for SPY has skyrocketed above 1.
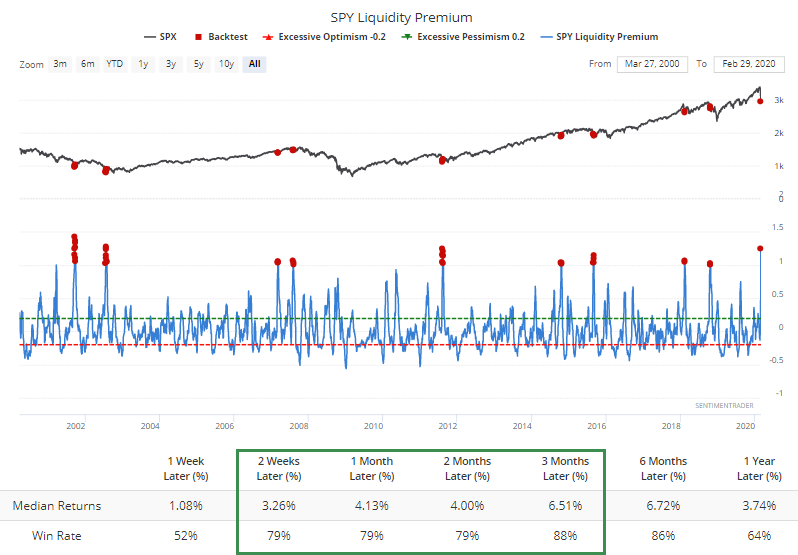
For QQQ, the Premium is the highest in its history, but it hasn't been as effective as an indicator. We've tested this on a variety of ETFs vs stocks over the years, and it works best on the most liquid of them all, SPY.
Inverse volume
When they're nervous, not only do traders reach for the most liquid ETFs, they also try to hedge with inverse funds. Those saw a near-record level of volume on Friday relative to total NYSE volume.
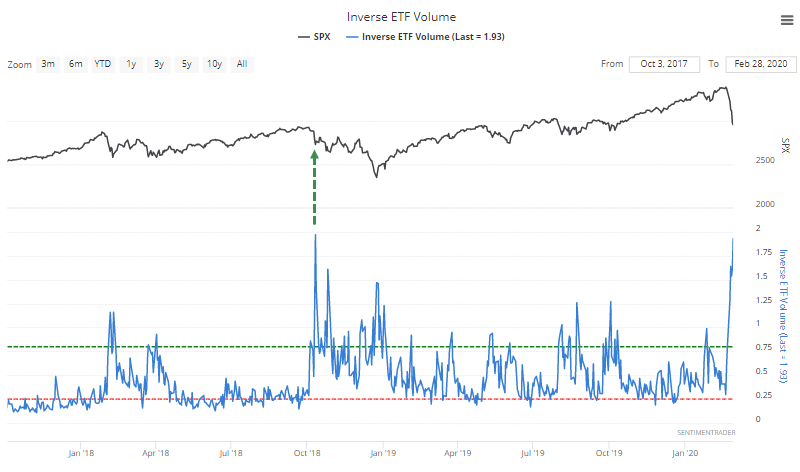
The last time it spiked this high, stocks found a short-term low, but it was only the beginning of a larger decline.
Fund flow
The get-me-out mentality can be seen in fund flows, with investors pulling more than $20 billion from equities, and that was before the late-week downside follow-through.
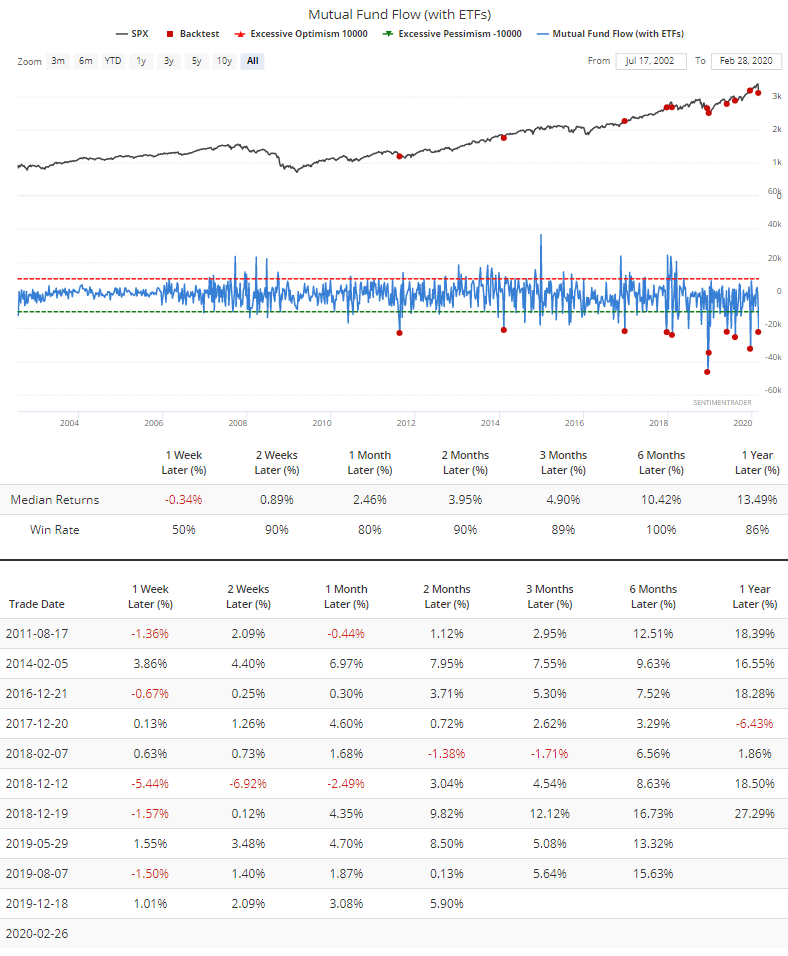
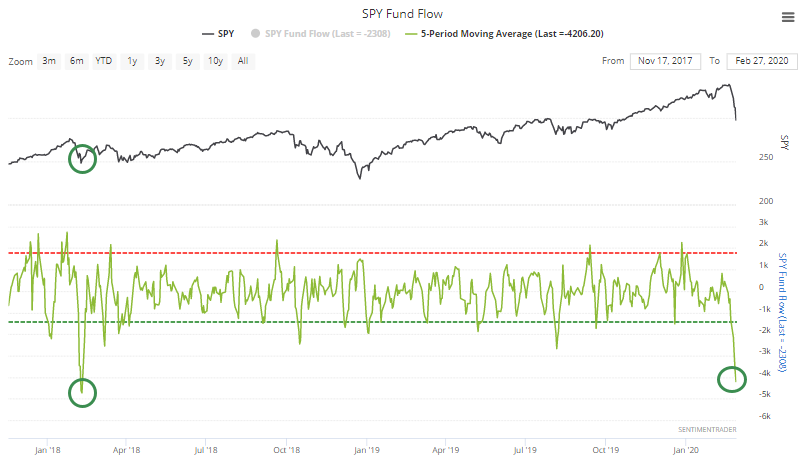
That was due in large part to trader fleeing some of the largest ETFs, like SPY. The largest fund in the world lost an average of $4 billion in assets per day in the week through Thursday (it lost another $4 billion on Friday). That's only matched by February 8, 2018.
Stocks vs. bonds
Because of the sharp moves in stocks vs safe-haven types of assets, the Stock/Bond Ratio plunged to one of the lowest readings in 50 years.
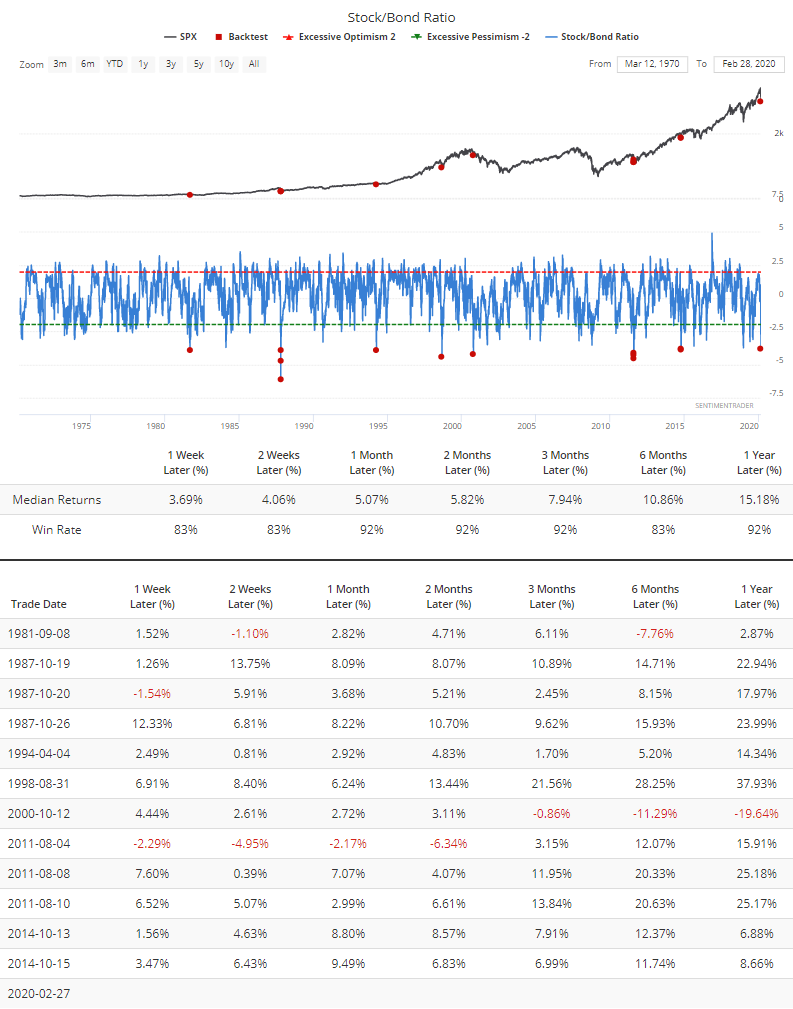
Almost without fail, stocks snapped back after the ratio between the two assets got this far out of whack. As we've noted in prior years, this is a better "buy" signal for stocks than it is a "sell" signal for bonds.
Feed them what they'll eat
Mainstream media producers spend a lot of time analyzing what their audience wants, and how to serve it to them. They have no choice because they need to get ratings to appease their advertising partners.
When it comes to market declines, that means using big, bold, red numbers and raised voices or big fonts. And if it's possible to wring a special report about it, all the better. CNBC has taken full advantage with a Markets In Turmoil special all 5 days.
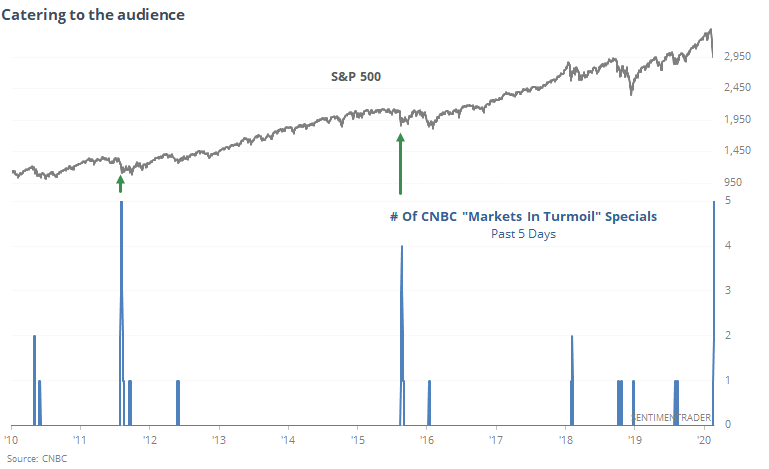
The only other times there was this large of a cluster of specials were August 10, 2011 and August 26, 2015.
To reiterate, the overall impression of all these studies and indicators is:
When we've seen price moves like this, with similar amounts of wholesale selling pressure, there was a very strong - almost universal - tendency to see rebounds over the next 2-3 months. That does not preclude violent shorter-term moves in both directions, and it does not preclude an eventual slide into a bear market. But even in those cases, stocks had a consistent tendency to recover in the month(s) ahead before rolling over.