
A Warning Sign Worth Knowing About - Part II

In Part I, we highlighted:
- A specific indicator as an "early warning" signal for the financial sector
- The fact that this warning also served as a warning for certain interest-rate sensitive sectors
- That it served as a warning sign for the broader U.S. and international stock markets
First, a quick review of our "early warning" indicator.
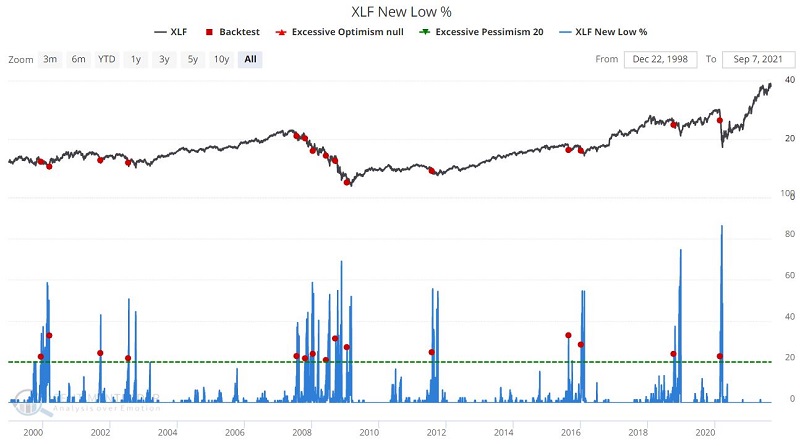
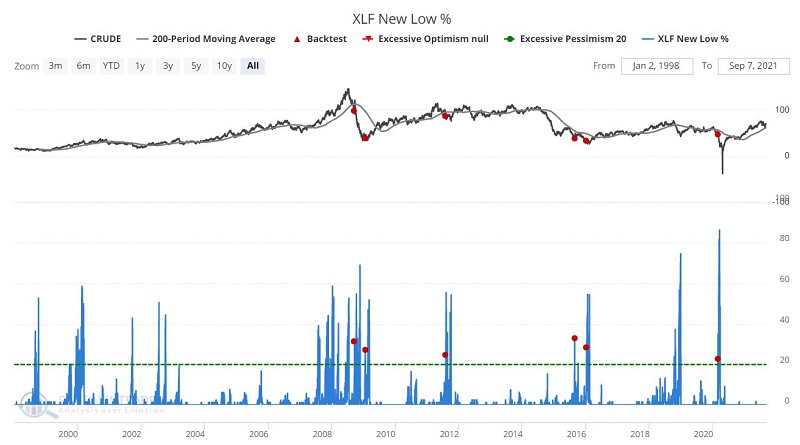
XLF NEW LOW %
As the title implies, this indicator shows the percentage of stocks in ticker XLF (Financial Select Sector SPDR Fund ) that are currently trading at a new 52-week low. When the percentage of stocks in the portfolio hitting new 52-week lows "spikes," it signals significant weakness within the financial sector.
The XLF New Low % indicator can be launched in the Backtest Engine by clicking here. It identifies those times when:
- The percentage of XLF constituents making new 52-week lows
- Reaches or exceeds 20%
- For the first time in 60 days
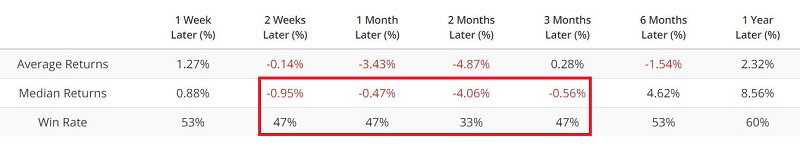
The chart below displays the signal dates since early 1999, and the table below displays some numerical results.
Our original theory was that trouble in the financial sector could have a "ripple effect." The results in Part I showed that this is the case for the overall broad market and interest rate-sensitive sectors specifically.
In Part II, we will look at several bond ETFs and commodities. Our theory this time is that money will find its way into different areas and asset classes when trouble is perceived to be brewing or unfolding in the stock market.
BONDS
Now let's look at two bond market ETFs. Even more so than financial stocks, bonds are strongly affected by changes in interest rates. Let's look at how two categories of bonds reacted after XLF New Low % exceeded 20% for the first time in 60 days.
The chart below displays the signal dates versus the ticker JNK (SPDR Bloomberg Barclays High Yield Bond ETF), and the table below displays some numerical results.
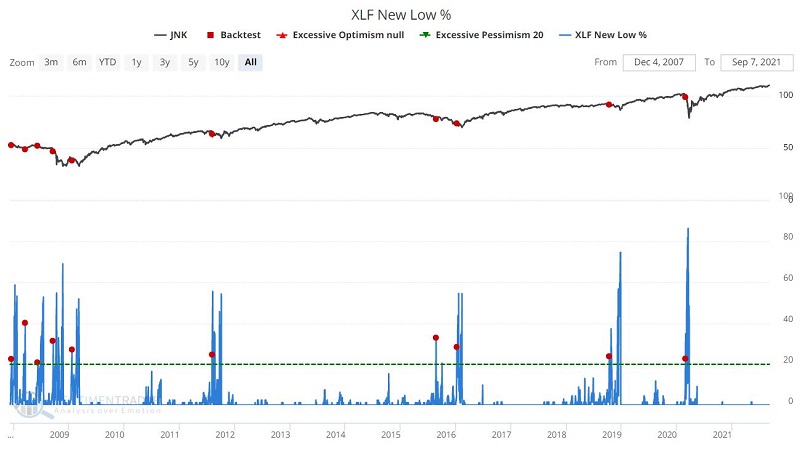
Note that:
- High-yield corporate bonds are much more highly correlated to stocks than to interest rates or straight treasury bonds
- As a result, they typically struggle initially when the financial sector runs into trouble
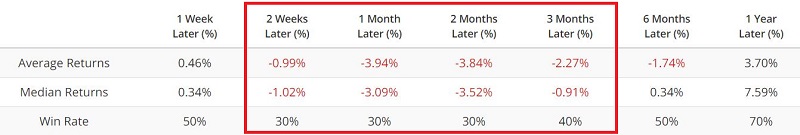
For 2 weeks to 2 months after a signal:
- The Win Rate is only 30%
- The Median Return is negative
- Results are particularly bearish during the 1-month and 2-month periods
Now let's turn our attention away from high-yield corporate bonds and towards the broader overall bond market.
One theory holds that:
- When trouble hits the financial sector
- The ripples affect the broader stock market
- Money moves out of stocks (at least temporarily) into the relative safety of bonds
Does this theory hold water?
The chart below displays the signal dates for our XLF New Low % indicator versus the ticker BND (Vanguard Total Bond Market Index Fund ETF Shares), and the table below displays some numerical results.
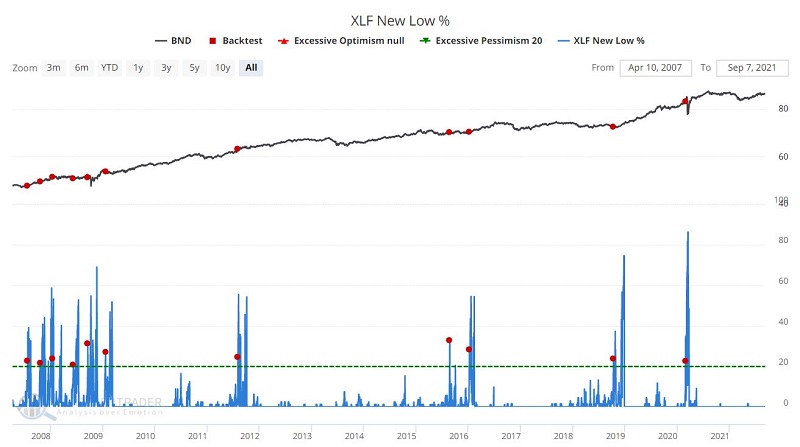
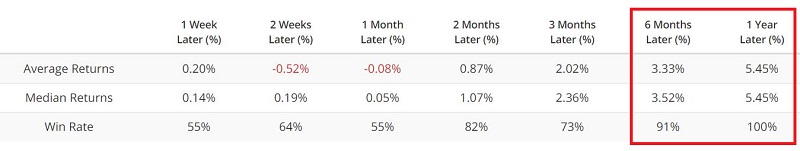
For the first time, we see some very positive results, in this case particularly in the 6-month to 1-year time periods:
- The Win Rate is 91% at 6-months and 100% at 1-year
- The Median Return is +5.45% at 1-year
- Even 2 and 3-month returns show a relatively high Win Rate
The bottom line: money flows to where it is treated best. When stocks wobble, bonds tend to offer stability.
COMMODITIES
Finally, let's go further afield and look at a couple of key commodities and see how they reacted after XLF New Low % exceeded 20% for the first time in 60 days.
The chart below displays the signal dates versus Gold, and the table below displays some numerical results.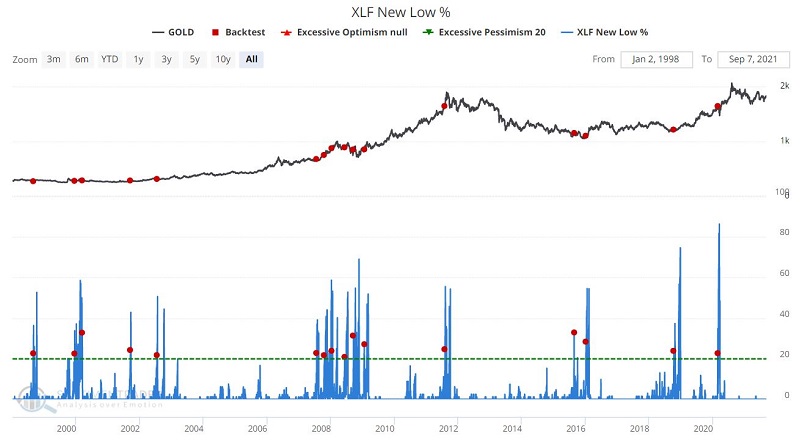
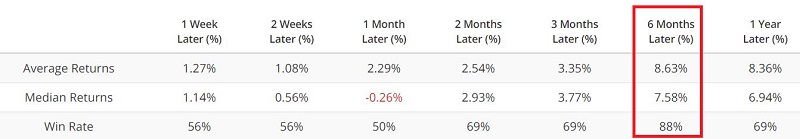
One can reasonably question whether there is any real cause and effect between the constituent stocks within ticker XLF and gold bullion itself. But for what it is worth, results are mildly positive - particularly at 6 months with:
- A Median Return of +7.58%
- A Win Rate of 88%
Once again, it may be less a case of "cause and effect" and more a case of money finding its way to other assets when there is trouble in the stock market.
Last but not least - and just as food for thought - we changed the rules slightly for crude oil, as follows. As with the previous tests, we start with:
- The percentage of XLF constituents making new 52-week lows
- Reaches or exceeds 20%
- For the first time in 60 days
We also added one more rule, stating that at the time of the above setup:
- Crude oil is already BELOW its 200-day moving average
We then:
- Wait 2 months before buying crude oil
- Hold crude oil for 10 months (i.e., selling 12 months after the original signal)
These rules are undoubtedly built on a bit of hindsight. Nevertheless, the results are fairly compelling.
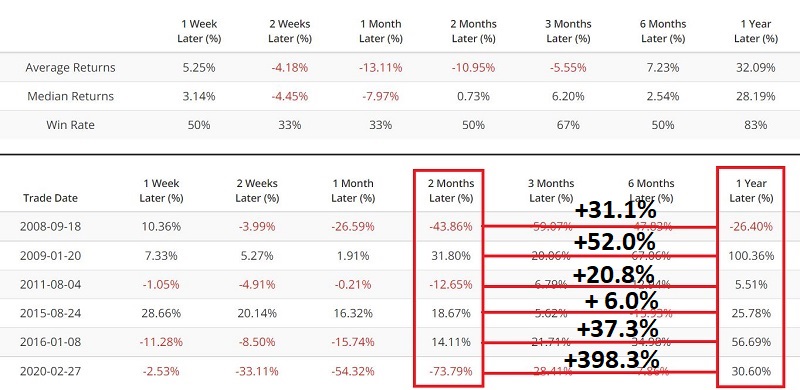
The black numbers listed in the table above display the change in the price of crude oil:
- From 2 months after an XLF signal
- To 12 months after an XLF signal
As you can see, some significant rallies in crude oil occurred between 2 months after and 12 months after XLF New Lows % exceeding 20% for the first time in 60 days while crude oil was below its 200-day moving average.
For example, after the 2008-09-18 signal, crude oil plummeted -43.86% in the next two months. However, in the ten months after that, crude oil rallied +31.1%.
Is there really a connection between financial stocks and crude oil 2 and 12 months later? It certainly seems like a stretch. But as I like to say, "opportunity is where you find it."
SUMMARY
In any event, the bottom line appears to be that trouble in the financial sector will lead to:
- Trouble in the broader stock market
- Money getting allocated to other areas and asset classes
- Opportunities arising away from the stock market
SAVING THE INDICATOR FOR FUTURE USE
To save this valuable "early warning" signal for future use:
Start by clicking here
- Click "Run Backtest"
- Then click "Save to Favorites"
- Type in a label such as "XLF New Low % crosses above 20%"
- Click "Save Favorite"