
A variation of the Zweig breadth thrust indicator triggered an alert

Key points:
- The Zweig breadth thrust indicator has maintained a value above 58% for eight consecutive sessions
- Sustained breadth imbalances of similar duration preceded solid S&P 500 gains over the next year
- Several chart illustrations show how this variation of the Zweig thrust can complement the original signal
Elevated Zweig breadth thrust indicator readings suggest a good overbought condition
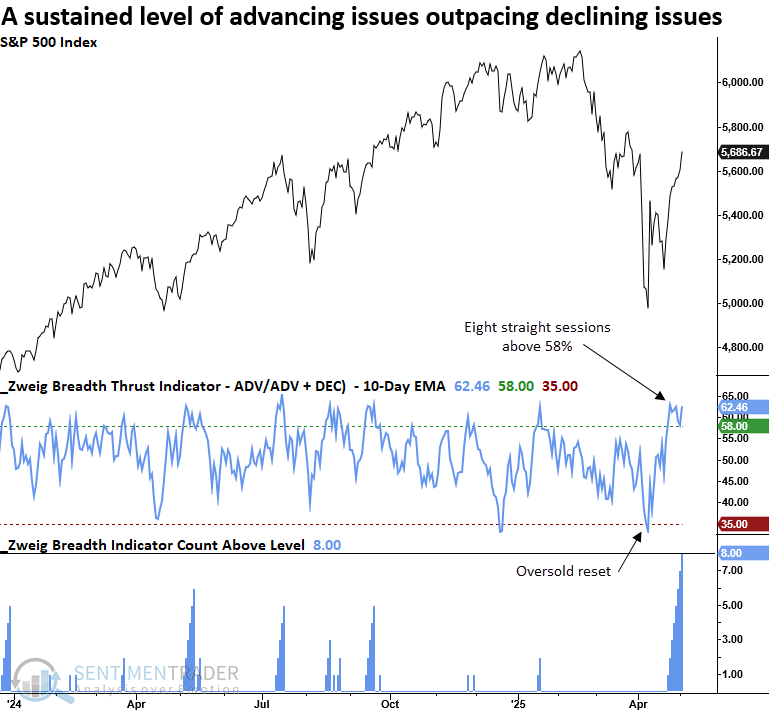
While the S&P 500's nine-day winning streak has captured considerable attention, a more impressive and arguably more meaningful streak has occurred under the surface.
The Zweig breadth thrust indicator has remained above 58% for eight consecutive sessions. This persistent strength in advancing issues hasn't been this pronounced since January 2023, when stock indexes last emerged from a bear market.
Although no indicator is infallible, sustained Zweig readings over 58% make a compelling case for adopting an overbought count methodology to detect buying pressure, complementing the original approach I highlighted in a recent report.
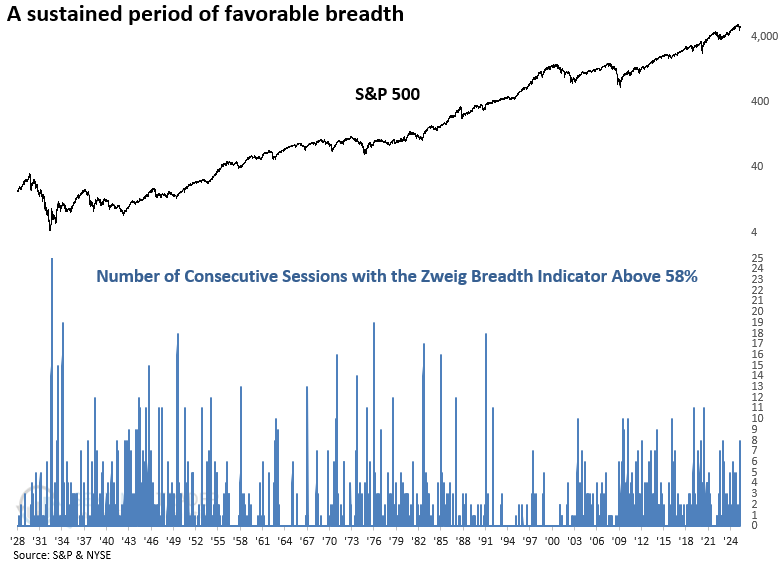
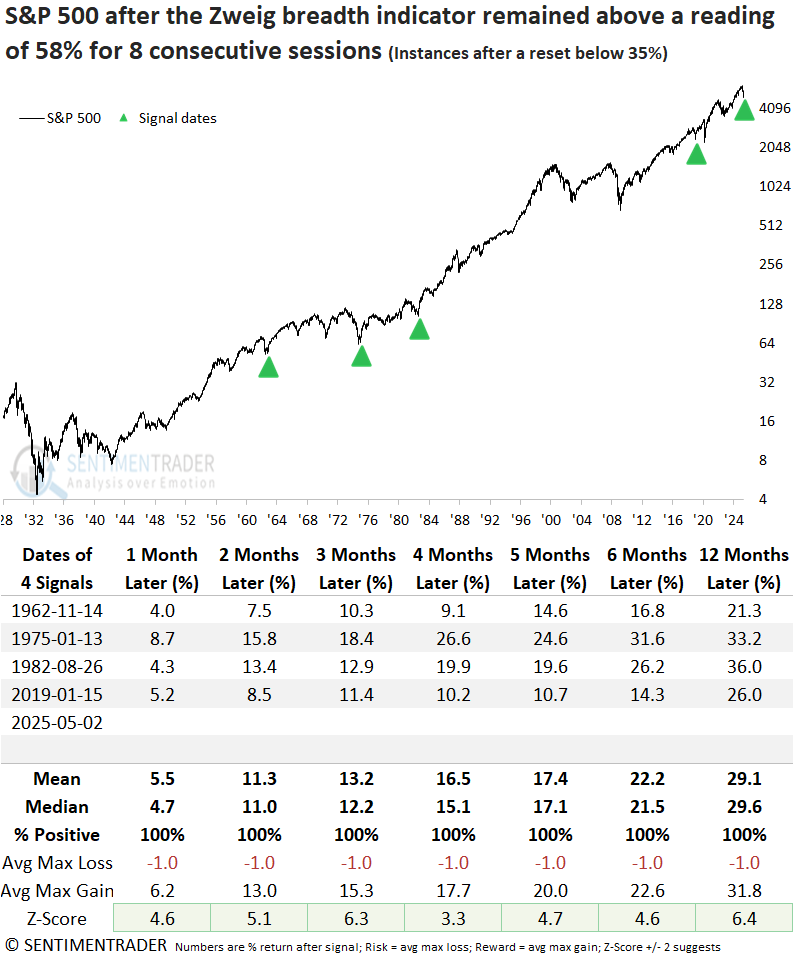
If you're curious how the current eight-day win streak above 58% compares historically, this chart offers some context. Before 1992, extended streaks above 11 days were more common.
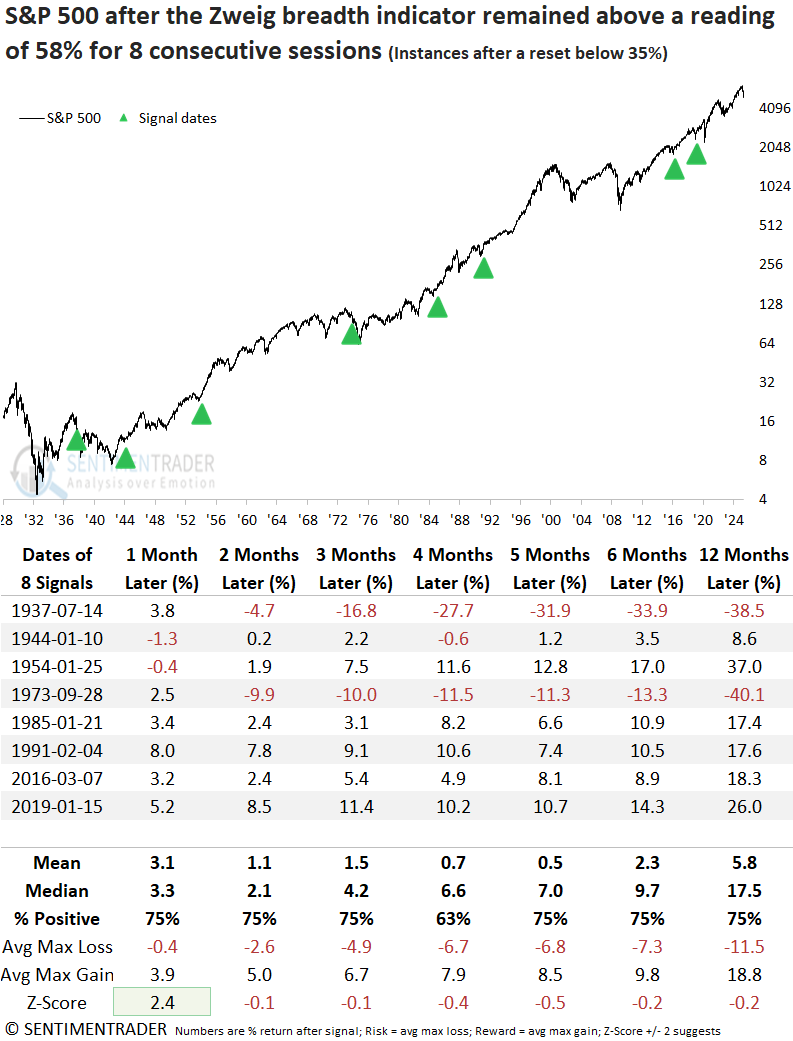
The Zweig breadth thrust indicator utilizes NYSE issues. To identify instances similar to now, I required the indicator to fall below 35% (a meaningful oversold condition) before a new signal could occur again.
Similar Zweig thrusts preceded a positive outcome for stocks
An elevated Zweig Breadth Indicator, such as now, has historically signaled persistent buying pressure, often leading to solid and steady gains in the S&P 500 over the next year.
Not once since 1982 has the signal produced a loss across any three-to-six or twelve-month timeframe, an extraordinary achievement.
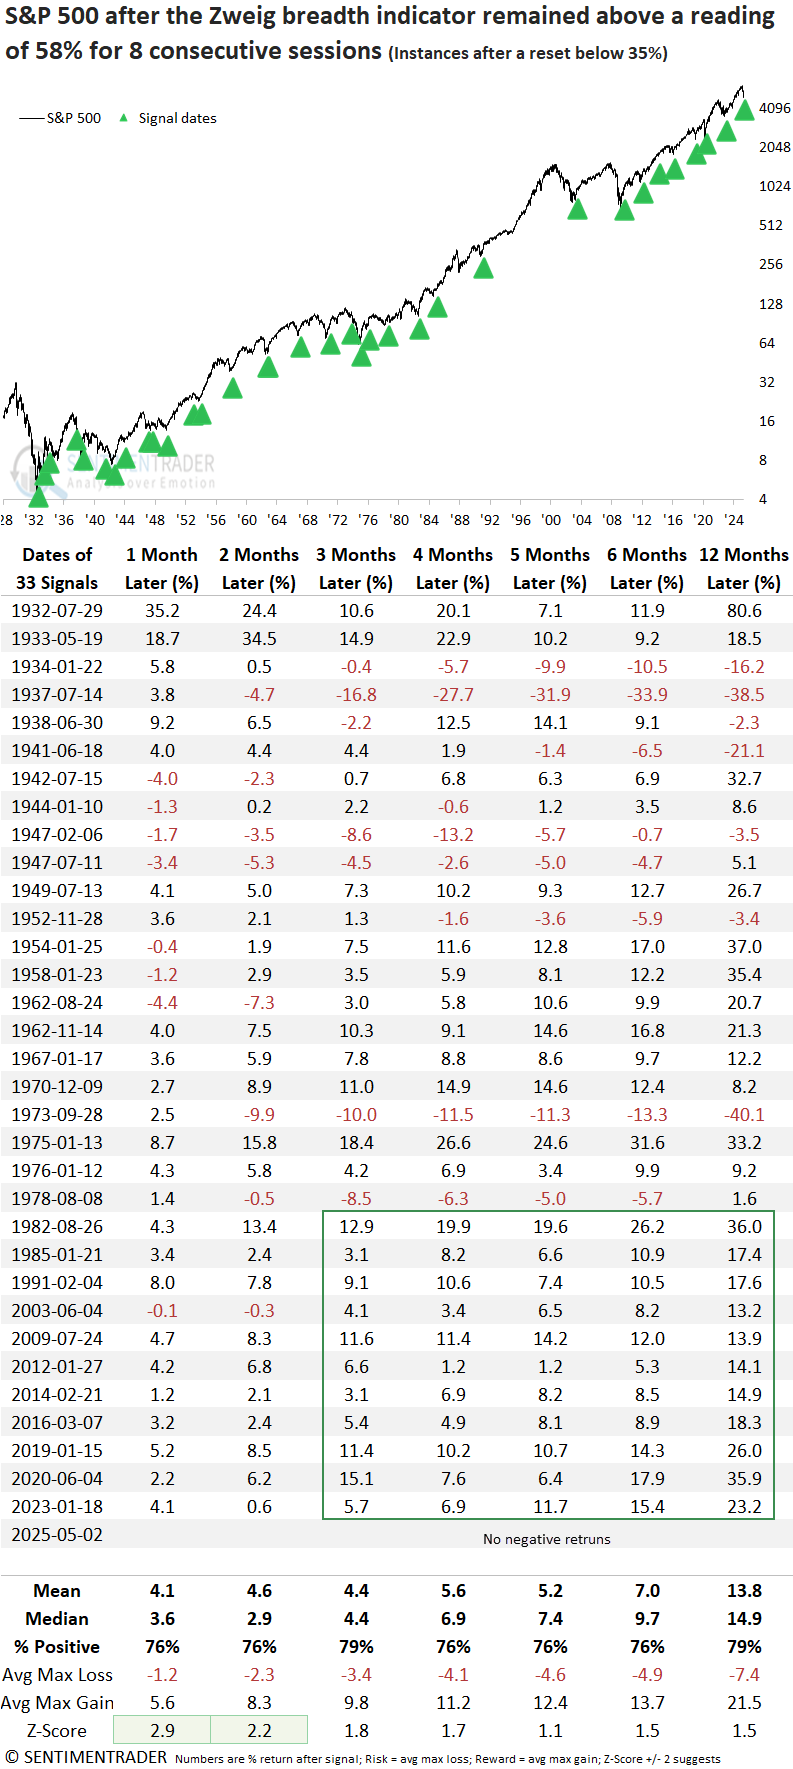
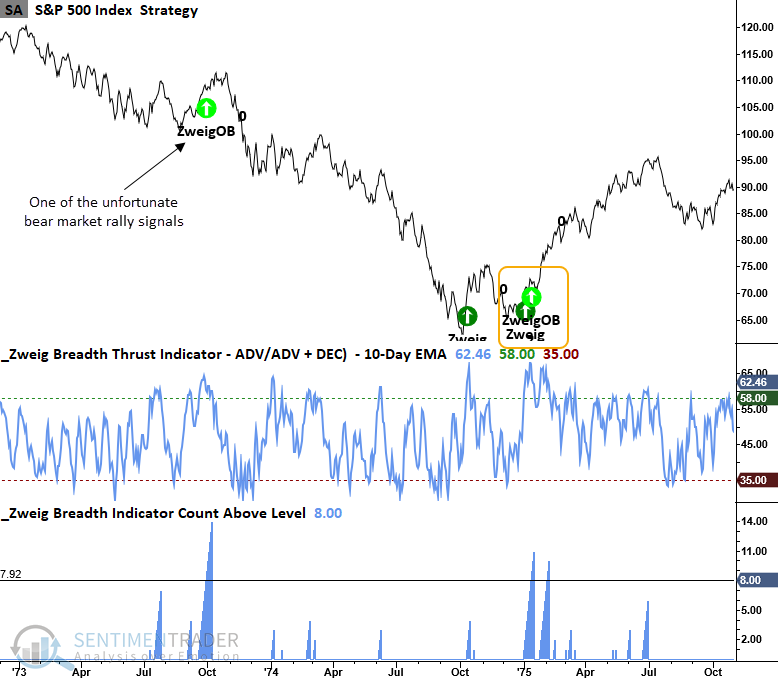
Two notable bear market rally signals
If I isolate past instances when the S&P 500 declined between 10% and 20%, similar to the current environment, two notable precedents emerge: 1937 and 1973. Both occurred during bear market rallies. However, the index rallied for another month in each case, gaining 3.8% and 2.5%, respectively.
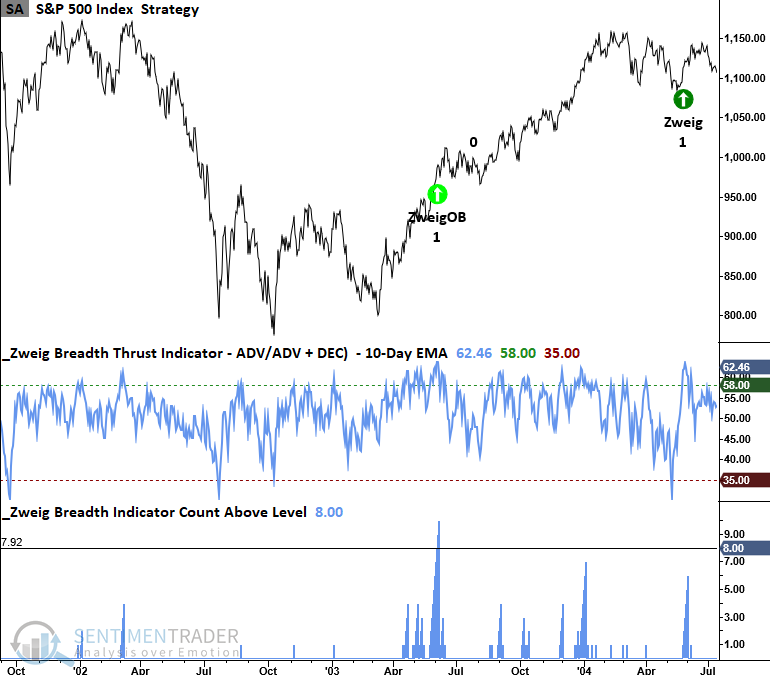
A historical perspective on Zweig thrusts versus Zweig overbought count thrusts
Coming out of the 2022 bear market, the Zweig overbought count signal triggered over two months before the original concept alert.
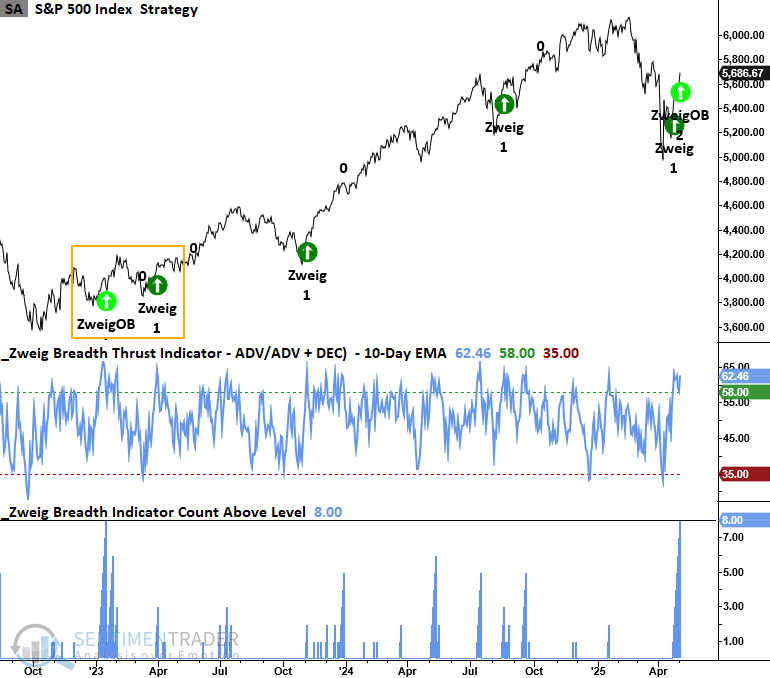
In 2018, the Zweig overbought count signal triggered shortly after the Zweig thrust. In case you were wondering, a double signal within ten sessions of each other has only occurred five times: 1962, 1975, 1982, 2018, and 2025.
Although the sample size is tiny, whenever the two different versions of the Zweig breadth thrust indicator triggered a signal within ten sessions of each other, the S&P 500 has never been lower across any timeframe.
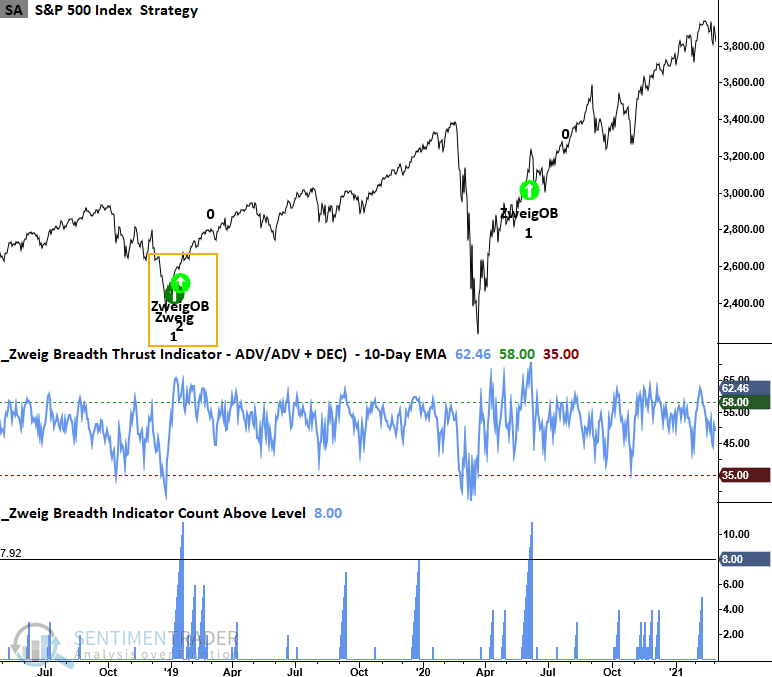
If you read my research report highlighting the Zweig thrust on April 25th, you may recall that I highlighted the whipsaw signal in 2015 as a risk. Interestingly, the Zweig overbought count alert triggered after the final low in the 2015-16 correction, providing a more favorable risk/reward scenario.
The signal in 2003 provided a much more timely alert than the Zweig thrust that eventually triggered in May 2004.
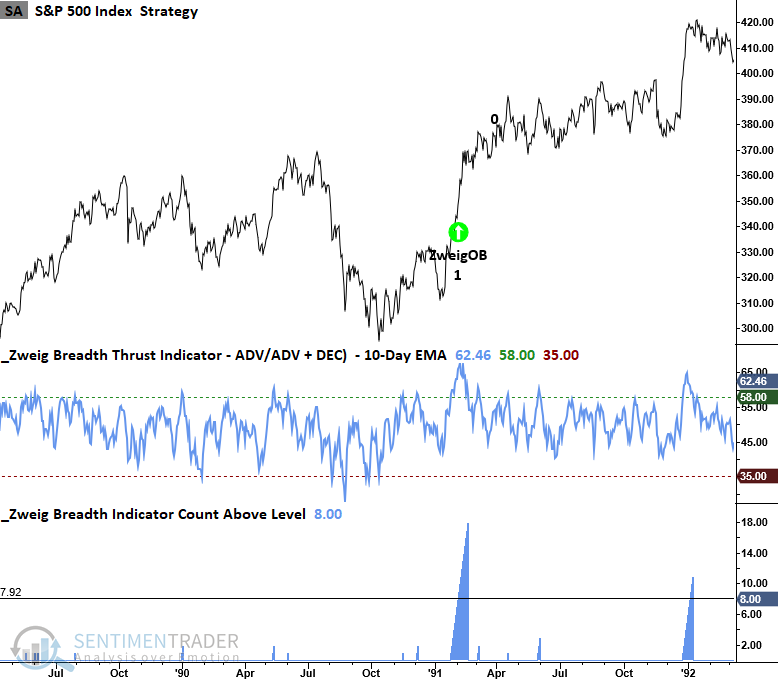
A Zweig thrust did not occur during the 1990 correction. However, the Zweig overbought count version did fire an alert.
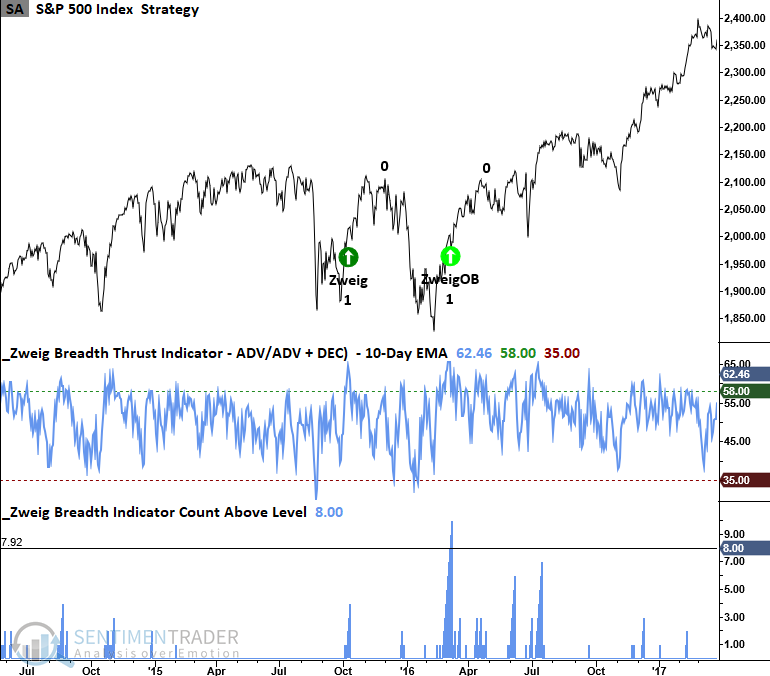
As noted earlier, the 1973 signal was one of the few alerts triggered during a bear market rally.
The Zweig overbought count signal triggered alerts after the 1956-57, 1966, 1968-70, and 1929-32 bear markets, periods when the original Zweig Thrust did not, further supporting its value as a system worth monitoring.
What the research tells us...
A variation of the Zweig Breadth Thrust indicator, which focuses not on the rapid reversal from oversold to overbought but on the persistence of elevated breadth readings, recently triggered an alert when the indicator remained above 58% for eight consecutive sessions. This sustained buying pressure reflects broad and consistent participation across NYSE issues, a condition historically associated with strong forward returns for the S&P 500. Indeed, following such signals, the index has typically delivered solid performance with notable consistency over the subsequent year. Traders would be wise to monitor this version of the indicator in tandem with the original thrust concept, as both provide valuable insight into the durability of market rallies.