
A trend-following approach to growth versus value

Key points:
- The performance of growth stocks relative to value stocks has fluctuated dramatically over time
- Growth stocks have led value stocks for most of the past 13 years
- The real value is in riding the long-term trend between them
The Growth versus Value debate
Some arguments among investors never seem to end. Stocks versus bonds. Large-caps versus small-caps. Growth versus value. U.S. domestic versus international. The list goes on.
At any given point in time, pundits and individual investors will make intelligent, impassioned arguments of why their favored investment is the place to be. The reality is, sometimes these arguments are correct, and sometimes they are wrong. The other fact is that no investment style argument is ever settled. There is a continuous back-and-forth that takes place in every relationship.
The most successful investors are the ones who can recognize which style is leading now and then focus their attention there while the trend plays out over time. Let's focus our attention on growth stocks versus value stocks.
How they compare over time
For our test, we will use monthly total return data for the S&P 500 Growth Index and the S&P 500 Value Index starting in January 1975. The chart below displays the growth of $1 invested in each index on a buy-and-hold basis since 1975.
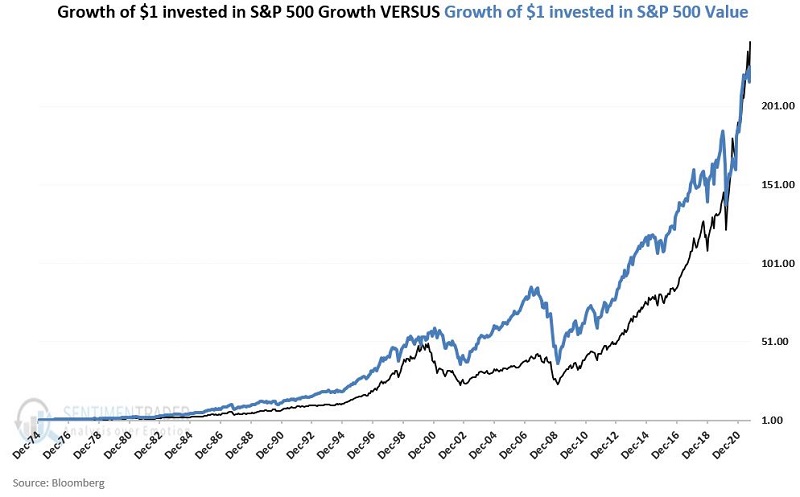
Value outperformed for much of the last 50 years, but growth has staged a phenomenal performance in the past 13 years. This recency bias has led many to declare that value is dead. It's not that clear.
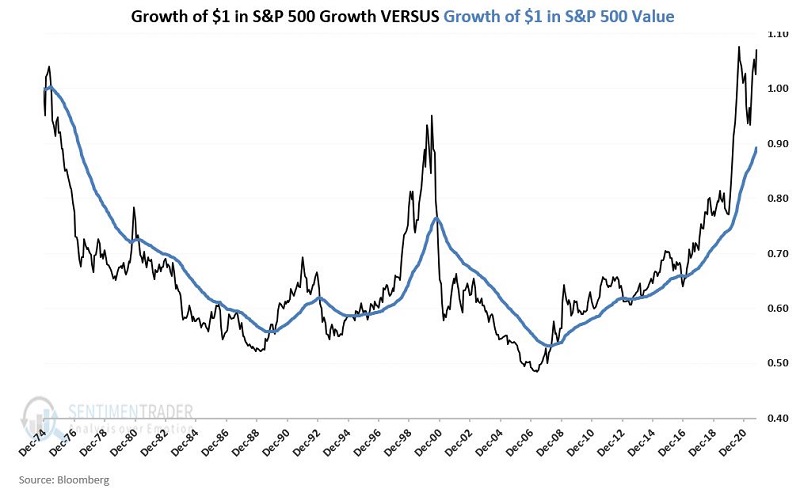
The chart below shows the cumulative growth of $1 invested in Growth versus Value since 1975.
The chart suggests that it is a mistake to assume that one investment style has or will ever establish a permanent advantage over the other. The back-and-forth swings are large and relatively cyclical.
Let's now turn our attention to objectively identifying turning points in this relationship.
Using a moving average to time the relationship
Our goal is to follow a simple long-term indicator to determine whether the trend currently favors Growth or Value. For this purpose, we will use the 48-month exponential moving average (EMA). This Investopedia article shows how to calculate an EMA; it's a bit more involved than a simple average but responds more quickly to recent moves.
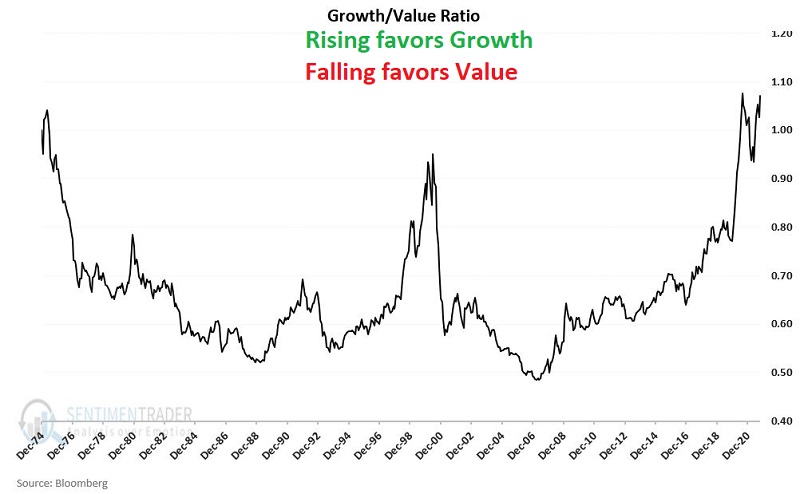
The chart below shows the Growth/Value Ratio along with its 48-month EMA.
At the end of each month, after calculating the 48-month EMA, we look at the Growth/Value Ratio in relation to its average, so it fluctuates above/below 0. That's what we see in the chart below and we'll refer to it as the Growth/Value Indicator (GVI)
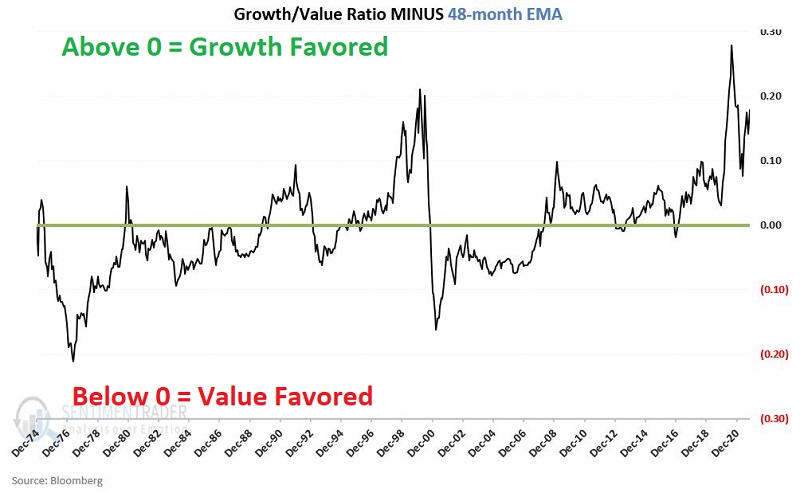
Hold Growth when GVI is positive
If the GVI is above 0 at the end of the current month, we will hold the S&P 500 Growth Index during the next month. If the GVI is below 0, we will hold the S&P 500 Value Index.
We will track the growth of $1 invested in this manner and call it our Switching Strategy. So, we will hold whichever index has demonstrated the stronger relative strength over the past 48 months.
The chart below shows the growth of $1 invested using the Switching Strategy versus buy-and-hold.

The cumulative growth from December 1974 through October 2021 for the Switching Strategy was +43,626%. For buy-and-hold, it was less than half that, at +21,609%.
Because the Switching Strategy is always fully invested in either Growth or Value, it is susceptible to significant drawdowns. Still, the doubling of return versus a buy-and-hold approach speaks to its potential usefulness.
The real key is consistency
Another important consideration is consistency. Inconsistent performance reduces the likelihood that an investor will stick with the strategy.
The chart below displays the ratio of the Switching Strategy return versus the buy-and-hold strategy return. When the ratio is rising, it means that the Switching Strategy is outperforming buy-and-hold and vice versa.
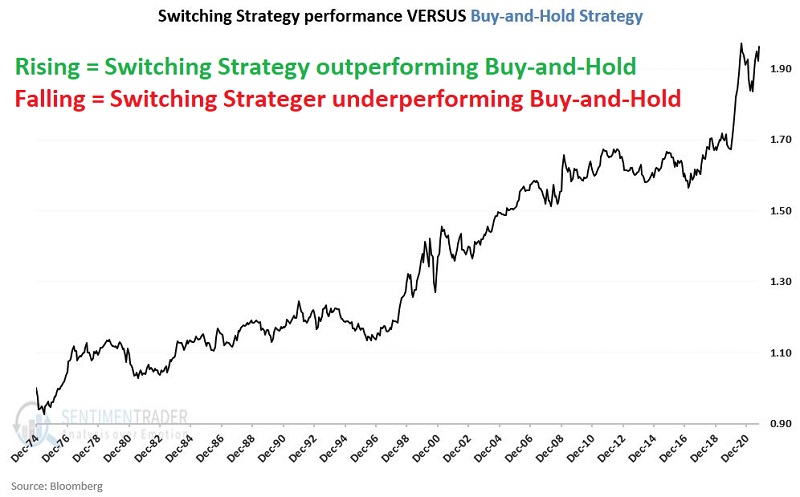
We can see that the line trends from lower left to upper right, suggesting a high degree of consistency in the Switching Strategy outperforming buy-and-hold.
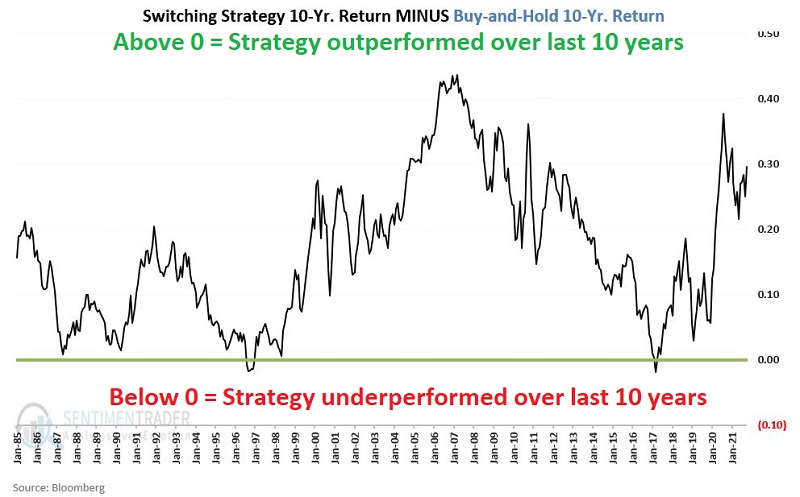
To emphasize this, the chart below shows the 10-year return for the Switching Strategy minus the 10-year return for buy-and-hold. The Switching Strategy outperformed during 98.6% of all rolling 10-year periods tested.
A caveat is that since the Switching Strategy rides long-term trends, it will never reverse near a significant turning point in the Growth/Value ratio. Once the ratio reverses for real, it will typically take months before the ratio crosses the 48-month EMA. As a result, an investor must accept that they will never catch a top or bottom, but that's the trade-off for a trend-following versus mean-reversion strategy.
What the research tells…
There is a long-term interplay between the performance of Growth stocks and Value stocks. A simple trend-following method has done an excellent job of capturing significant swings in this relationship. Currently, the method clearly favors Growth stocks and will for some time, but an investor utilizing this approach must adopt and adhere to a long-term mindset because it will never catch the turning points.