Data &
Technology
Research
Reports
Report Solutions
Reports Library
Actionable
Strategies
Free
Resources
Simple Backtest Calculator
Simple Seasonality Calculator
The Kelly Criterion Calculator
Sentiment Geo Map
Public Research Reports
Free Webinar
Pricing
Company
About
Meet Our Team
In the News
Testimonials
Client Success Stories
Contact
Log inLoginSign up
< BACK TO ALL REPORTS

A Trade-Related Gap

Jason Goepfert
2019-09-05
null

Stock futures are jumping this morning, with another trade-related headline. Per the WSJ:

That has sent S&P 500 futures more than 0.75% above yesterday's close. It's often questionable to assign movements in the futures to a single issue, but this one seems pretty clear.

Traders have been jerked around by rumors on this front for over a year, but this is an actual, sold headline that appears to be confirmed by both sides.

Using a trade timeline provided by China Briefing, we can see whether other big positive opening gaps, on days when there was a positive trade headline, ended up following through.

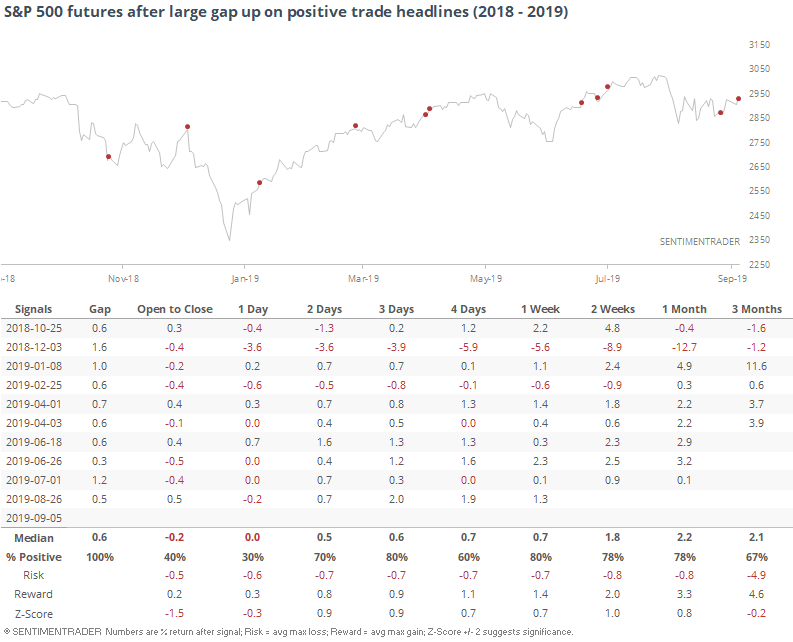
For the most part, no they didn't, at least in the very short-term. The futures followed through on the gap by adding to their gains over the next day only 3 times, while falling back 7 times.

The weakness was mostly confined to that very short-term, though. Most of them did show gains over the next 3-5 days, with only one showing a large loss when stocks collapsed into late December.

It's hard to rely on price action when it seems to be heavily influenced by the latest tweet, and this could be upended in a moment by an off-the-cuff post, but based on this admittedly shaky history, this ostensibly positive development should lead to further gains over the coming days.

It should be further helped along by the recent broad-based buying pressure, as Troy noted with yet another day showing big volume in advancing stocks yesterday.

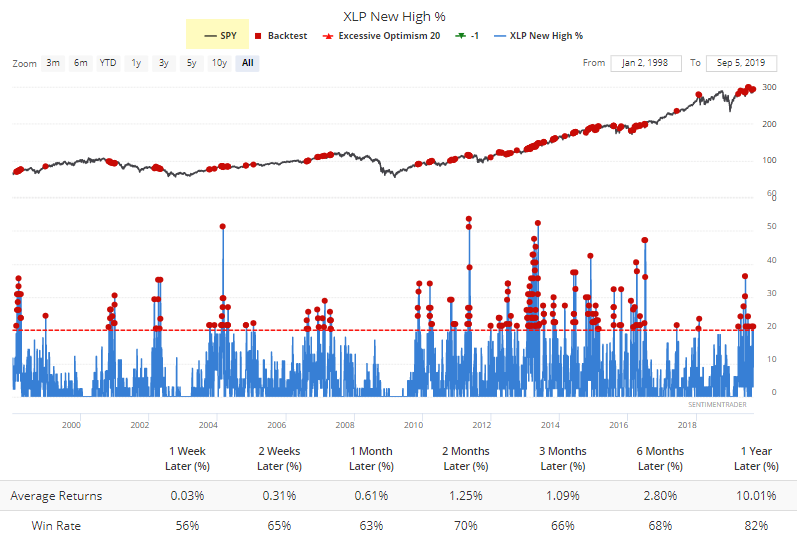
We've seen a lot of signs of abnormally heavy risk-aversion in recent weeks, even lately with a choppy recovery in stocks. Another sign of that has popped up over the past couple of days with a surge in 52-week highs among the most defensive sectors. Yesterday, more than 20% of staples hit a new high. Its forward returns were below average over the next couple of weeks, but more interesting is the return in SPY after this happens.

Even more notable, though, is the surge in 52-week highs among utilities. This has typically happened when investors were anxious about growth or rates, and has led to even more positive returns for the S&P 500. To run this test, just click this link then click the Run Backtest button and then the Multi-Timeframe Returns tab.

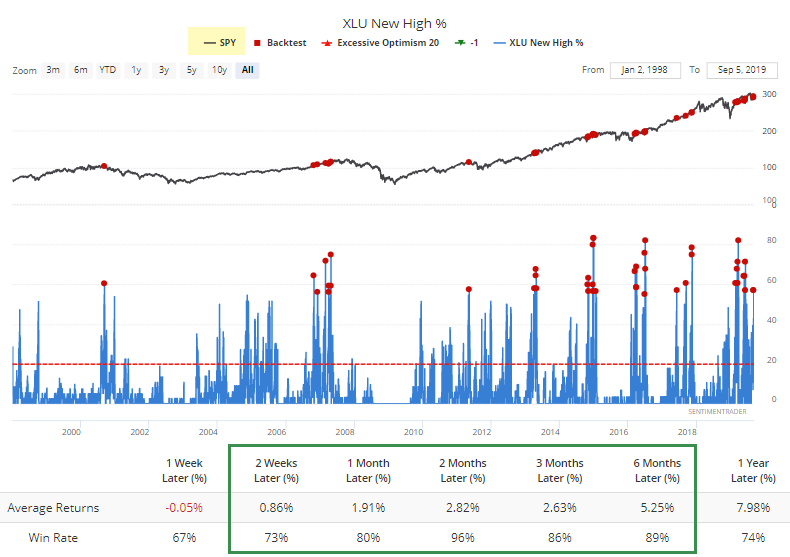
There have been 45 days when more than 55% of utility stocks hit a 52-week high, and the S&P 500 showed a positive return two months later after 43 of them.

It's been hard to chase breakouts because so many of them have failed, but given all of the pessimism lately, it seems like this one has a better chance than most of following through.

Sorry, you don't have access to this report

Upgrade your subscription plan to get access
Go to Dasboard
DATA &
TECHnologies
IndicatorEdge
‍
BackTestEdge
‍
Other Tools
‍
DataEdge API
RESEARCH
reports
Research Solution
‍
Reports Library
‍
actionable
Strategies
Trading Strategies
‍
Smart Stock Scanner
‍
FREE
RESOUrCES
Simple Backtest
Calculator
Simple Seasonality
Calculator
The Kelly Criterion
Calculator
Sentiment Geo Map
‍
Public Research Reports
‍
Free Webinar
COMPANY
‍
About
‍
Meet our Team
‍
In the News
‍
Testimonials
‍
Client Success Stories
Pricing
Bundle pricing
‍
Announcements
‍
FAQ
© 2024 Sundial Capital Research Inc. All rights reserved.
Setsail Marketing
TermsPrivacyAffiliate Program
Risk Disclosure: Futures and forex trading contains substantial risk and is not for every investor. An investor could potentially lose all or more than the initial investment. Risk capital is money that can be lost without jeopardizing ones’ financial security or life style. Only risk capital should be used for trading and only those with sufficient risk capital should consider trading. Past performance is not necessarily indicative of future results.

Hypothetical Performance Disclosure: Hypothetical performance results have many inherent limitations, some of which are described below. No representation is being made that any account will or is likely to achieve profits or losses similar to those shown; in fact, there are frequently sharp differences between hypothetical performance results and the actual results subsequently achieved by any particular trading program. One of the limitations of hypothetical performance results is that they are generally prepared with the benefit of hindsight. In addition, hypothetical trading does not involve financial risk, and no hypothetical trading record can completely account for the impact of financial risk of actual trading. for example, the ability to withstand losses or to adhere to a particular trading program in spite of trading losses are material points which can also adversely affect actual trading results. There are numerous other factors related to the markets in general or to the implementation of any specific trading program which cannot be fully accounted for in the preparation of hypothetical performance results and all which can adversely affect trading results.

Testimonial Disclosure: Testimonials appearing on this website may not be representative of other clients or customers and is not a guarantee of future performance or success.