
A Titanic Syndrome alert - and two potential lifeboats

Key points
- The NASDAQ Titanic Syndrome indicator may be flashing an early warning sign
- The current condition is not an actual trading signal or immediate call to action but rather an alert
- The condition raises longer-term concerns for stock-related investments, but two other markets may offer a safe haven
Nasdaq Titanic Syndrome raises a warning flag
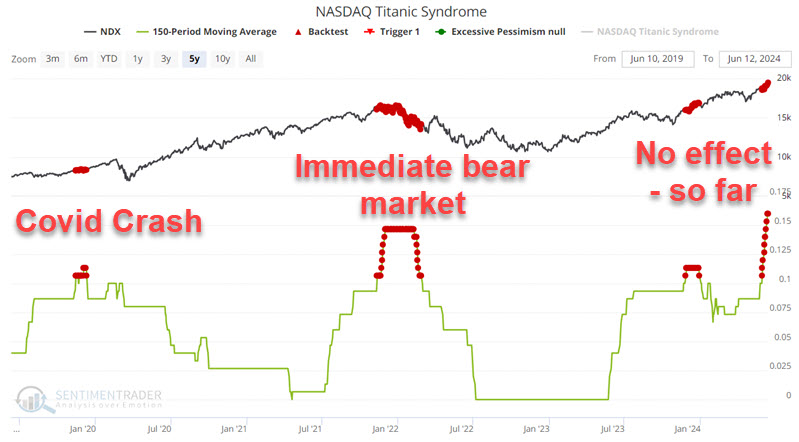
Bill Omaha created the Titanic Syndrome in the 1960s. It highlights a technical market condition when stocks have recently been at a high, and then there is a sudden jump in new 52-week lows versus highs on the Nasdaq. For our purposes, we use the following conditions: 1) The Nasdaq 100 closed at a 52-week high at some point in the past seven sessions, and 2) New 52-week lows outnumber 52-week highs on the Nasdaq. It is a warning sign that typically precedes trouble over the next 12 months. However, market performance leading up to any trouble often varies widely from incident to incident.
In the tests below, we use a 150-day moving average of the Nasdaq Titanic Syndrome indicator as an alert to potentially troubling conditions in the longer term. Specifically, we are looking for days when the 150-day moving average is above 0.10. Let's be explicitly clear about what that alert says and does not say:
- This alert does not say "sell everything" or even "sell now," for that matter
- This alert does say, "There is likely to be some trouble sometime in the next twelve months, and that trouble could include a significant market decline, so be prepared to act if price action shows signs of breaking down"
A Titanic Syndrome signal is often a good time to invoke:
Jay's Trading Maxim #18: Follow the trend, but DO NOT fall in love with the trend.
The chart below highlights with a red dot each day when the 150-day moving average for the Nasdaq Titanic Syndrome indicator was 0.10 or higher.
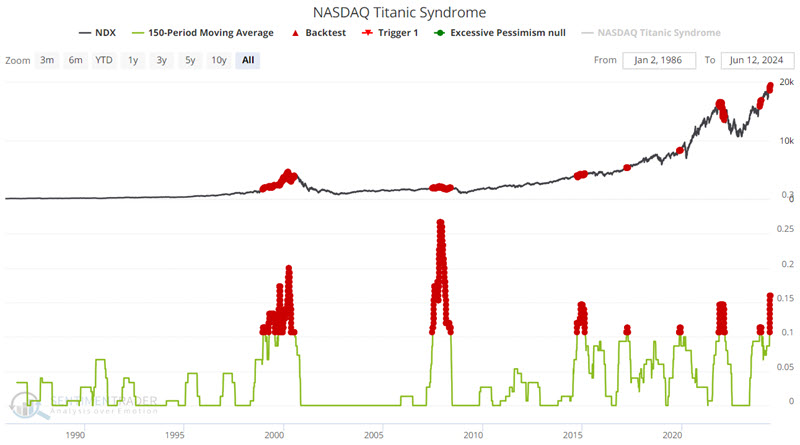
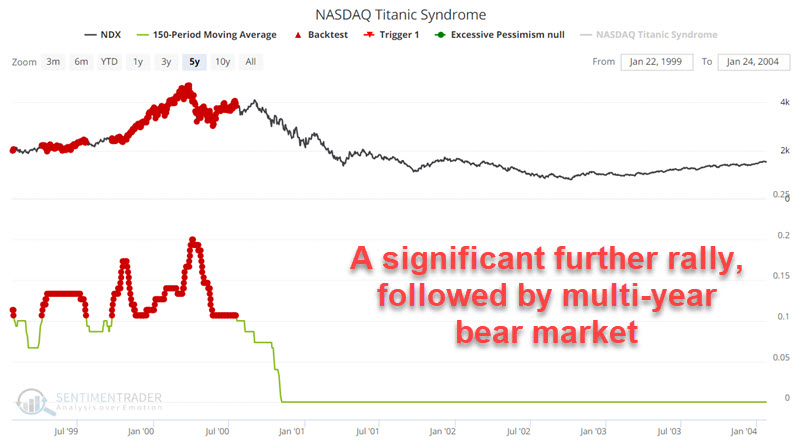
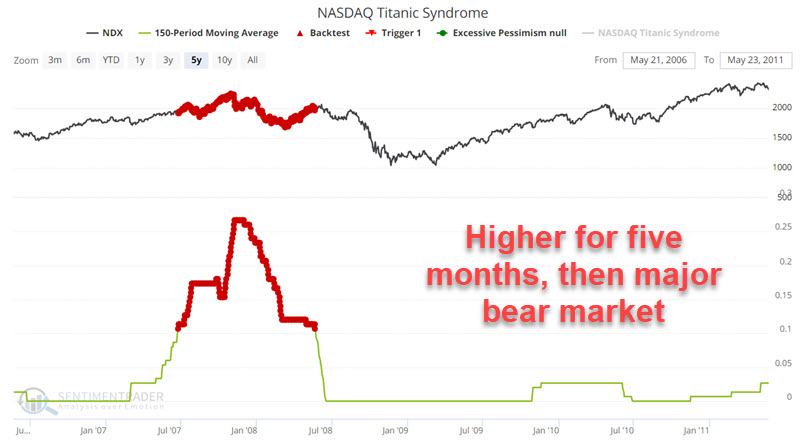
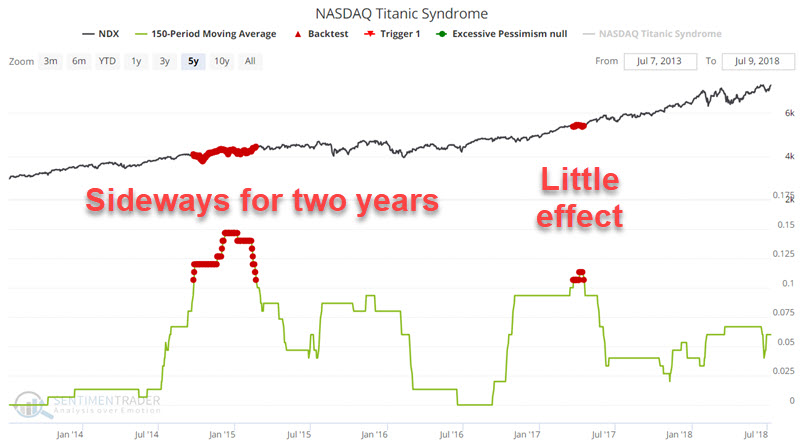
The charts below break the chart above into shorter periods for a closer look at market action. The frustrating thing to note when viewing these charts is that there is no set pattern for how soon after a signal the market runs into trouble or how severe that trouble is. As I said, remember that it is an "alert" and not a "signal."
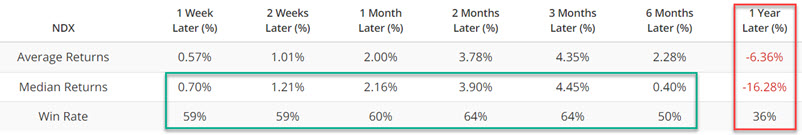
The table below summarizes Nasdaq 100 performance following the dates highlighted with a red dot. Overall results through six months are subpar from the long-term average, but the overall net result is still positive. Twelve-month results show only a 36% Win Rate and a median 12-month decline of -16.28%.
High-yield bonds could be another weak spot
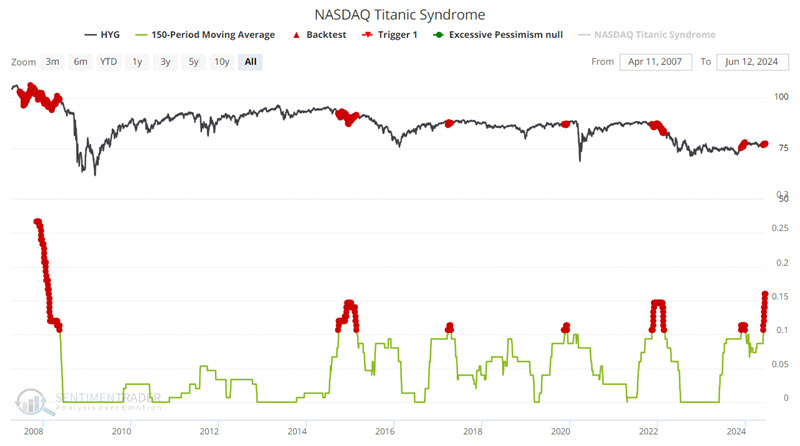
High-yield corporate bonds trade with a higher correlation to stocks than to treasury bonds. So, what tends to be unfavorable for stock prices is also typically adverse for high-yield bonds.
The chart below highlights with a red dot each day when the 150-day moving average for the Nasdaq Titanic Syndrome indicator was 0.10 or higher using iShares iBoxx $ High Yield Corporate Bond ETF (ticker HYG).
The table below summarizes HYG performance following the dates highlighted with a red dot. Results for six and twelve months are exceptionally weak, with a 12-month Win Rate of 0% and a median decline of -13.06%.
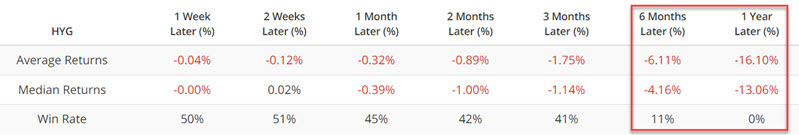
A 0% historical Win Rate does not guarantee that high-yield bonds will be lower twelve months from now. But these results suggest being wary of overstaying one's welcome in the high-yield bond sector.
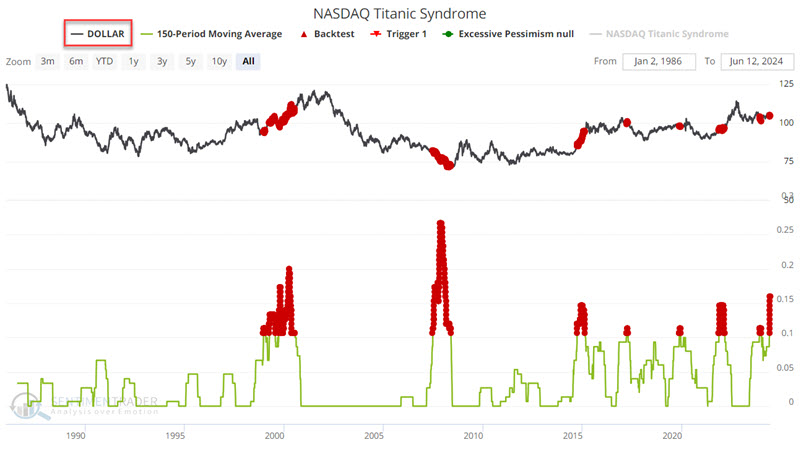
Two potential ports in the storm - the U.S. Dollar and commodities
The chart below highlights with a red dot each day when:
- The 150-day moving average for the Nasdaq Titanic Syndrome indicator was 0.10 or higher
- And the U.S. Dollar was above its 200-day moving average
This test adds a simple moving average trend filter (i.e., the dollar must be trading above its 200-day moving average to trigger a signal).
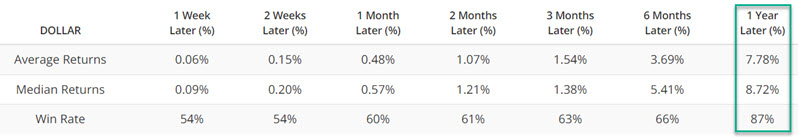
The table below summarizes U.S. Dollar performance following the dates highlighted with a red dot. Results for two to twelve months show an above-average Win Rate over 74%, and the 12-month Win Rate is exceptionally high at 93%.
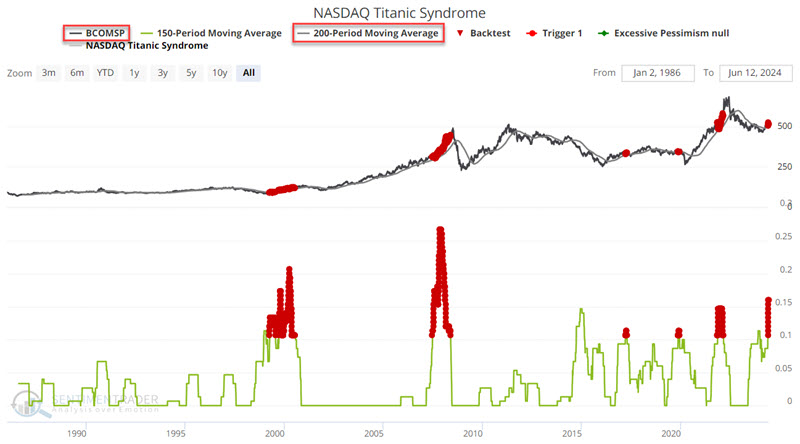
Now, let's look at commodities as an asset class. The chart below highlights with a red dot each day when:
- The 150-day moving average for the Nasdaq Titanic Syndrome indicator was 0.10 or higher
- And the Bloomberg Commodity Index (BCOMSP) was above its 200-day moving average
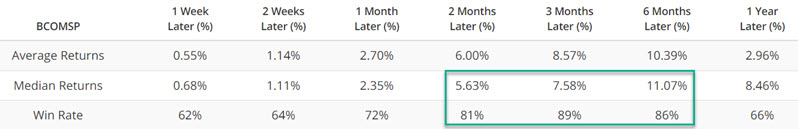
The table below summarizes commodity performance following the dates highlighted with a red dot. Results for two, three, and six months show above-average Win Rates of 81%, 89%, and 86%, respectively.
What the research tells us…
The knee-jerk reaction to the results above might be an inkling to sell stocks and high-yield bonds and to buy commodities and the U.S. Dollar. But that is not really the message investors should take away. A closer look at the results above reveals that there is no ordinary pattern that each market follows following a Titanic Syndrome alert and that results can vary widely from event to event.
An alert from the NASDAQ Titanic Syndrome merely highlights that something may be going on under the surface of the stock market that could lead to dramatic changes in the months ahead. Nothing more, nothing less. So, no need to "take action." Just remember, you have been forewarned.