Products
SentimenTrader Trading Tools
‍
Backtest Engine
My Trading Toolkit
Correlation Analysis
Seasonality
Market Prediction
Indicators & Data API
‍
Proprietary Indicators & Charts
Market Data API
Strategies & Scanner
‍
50+ Trading Strategies
Smart Stock Scanner
Smart Option Scanner
Research Reports
‍
Research Solutions
Reports Library
Free Resources
Simple Backtest Calculator
Simple Seasonality Calculator
The Kelly Criterion Calculator
Sentiment Geo Map
Public Research Reports
Education
Sentiment Indicators
Technical Indicators
Pricing
Company
About
In the News
Testimonials
Client Success Stories
Contact
Log inLoginSign up
< BACK TO ALL REPORTS

A thrust signal with an almost perfect record triggered an alert

Dean Christians
2023-12-20
The percentage of S&P 1500 stocks trading above their respective 50-day average cycled from less than 20% to greater than 90%, triggering a bullish thrust signal. After similar alerts, the S&P 500 was higher 96% of the time over the subsequent six months.

Key points:

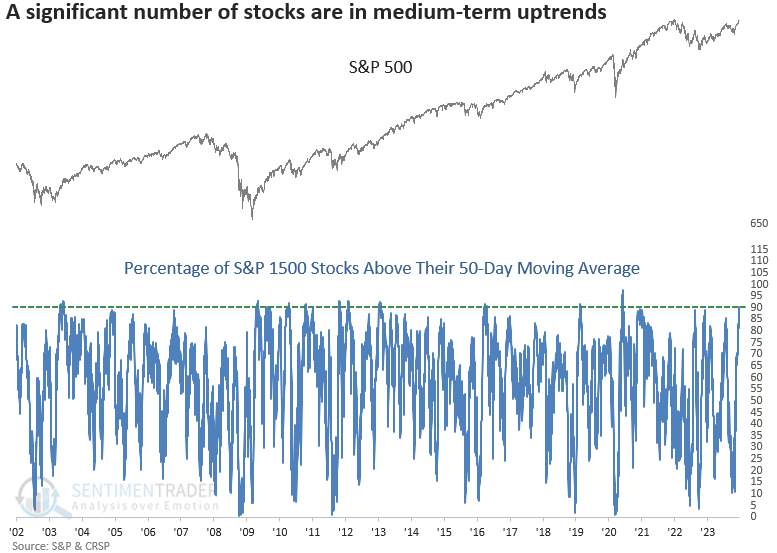
  • Over 90% of S&P 1500 stocks closed above their respective 50-day moving average 
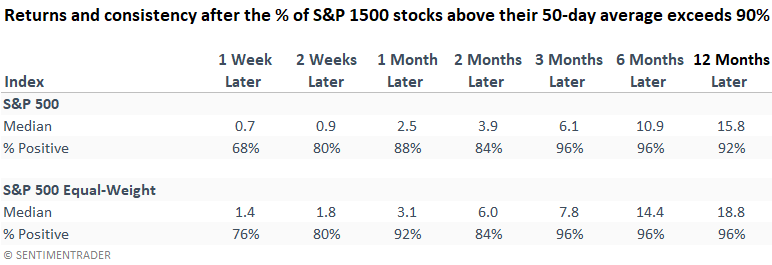
  • After similar thrusts, the S&P 500 was higher 96% of the time over the subsequent six months
  • The equal-weighted S&P 500 tended to outperform the cap-weighted version across all horizons

Participation is on the rise across the entire market-cap spectrum 

An old Wall Street adage says the market climbs a wall of worry. For most of 2023, one of those worries centered around the lack of participation from most stocks. 

For those who analyze market history, much like the team at Sentimentrader, the understanding is clear: rising interest rates create a dichotomy of winners and losers, with a noticeable decline in overall participation. 

However, as the interest rate environment improves, stocks tend to rally sharply, a trend that has unfolded in the last six weeks. 

On Tuesday, the percentage of S&P 1500 stocks closing above their respective 50-day average increased above 90% for only the 26th time since 1962. The previous signal occurred in May 2020, leading to a substantial stock rally.

Similar medium-term thrust signals preceded excellent returns

Whenever the percentage of S&P 1500 stocks trading above their 50-day moving average increases above 90%, like now, the S&P 500 displayed outstanding results across all time frames. Three and six months later, the world's most benchmarked index was higher in all but one precedent. A year later, it was higher in all but two cases.

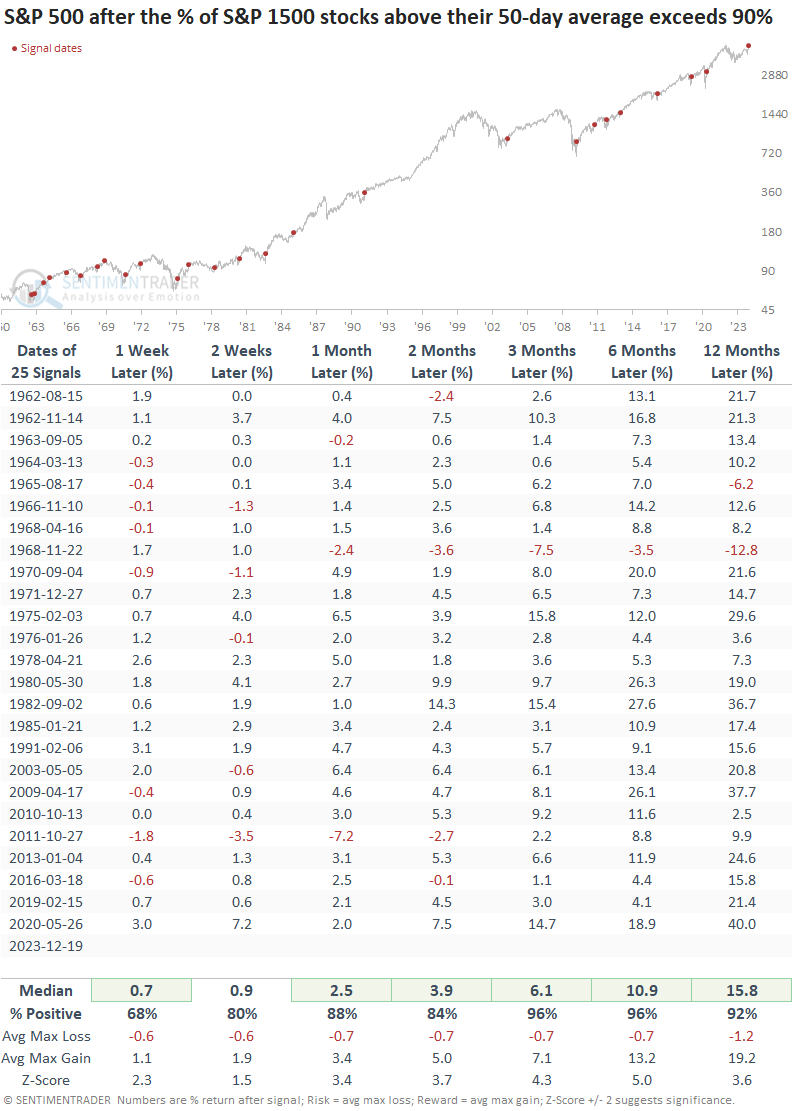
To provide a similar context to now, I required the indicator to fall below 20% before a new signal could be triggered again.

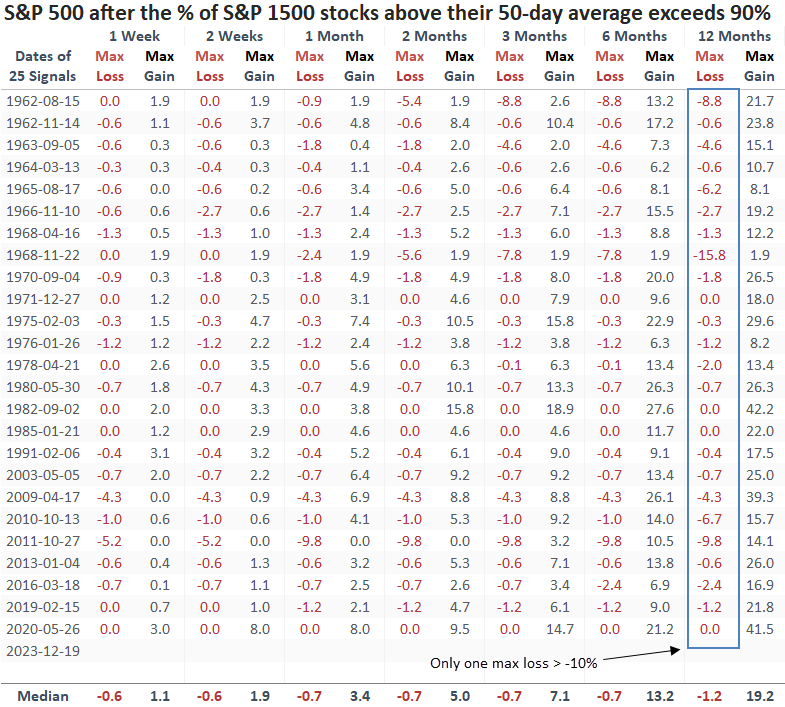
Favorable risk/reward

Over the following twelve months, the S&P 500 experienced only one loss exceeding -10% and five more significant than -5%. The median drawdown was a minuscule -1.2%, while the median drawup (maximum gain) was +19.2%. 

Suppose I apply the signals to the equal-weighted S&P 500, where each of the 500 stocks holds an identical weight, rather than the capitalization-weighted index that gives preference to the largest stocks. In that case, the forward return outlook is even more impressive. 
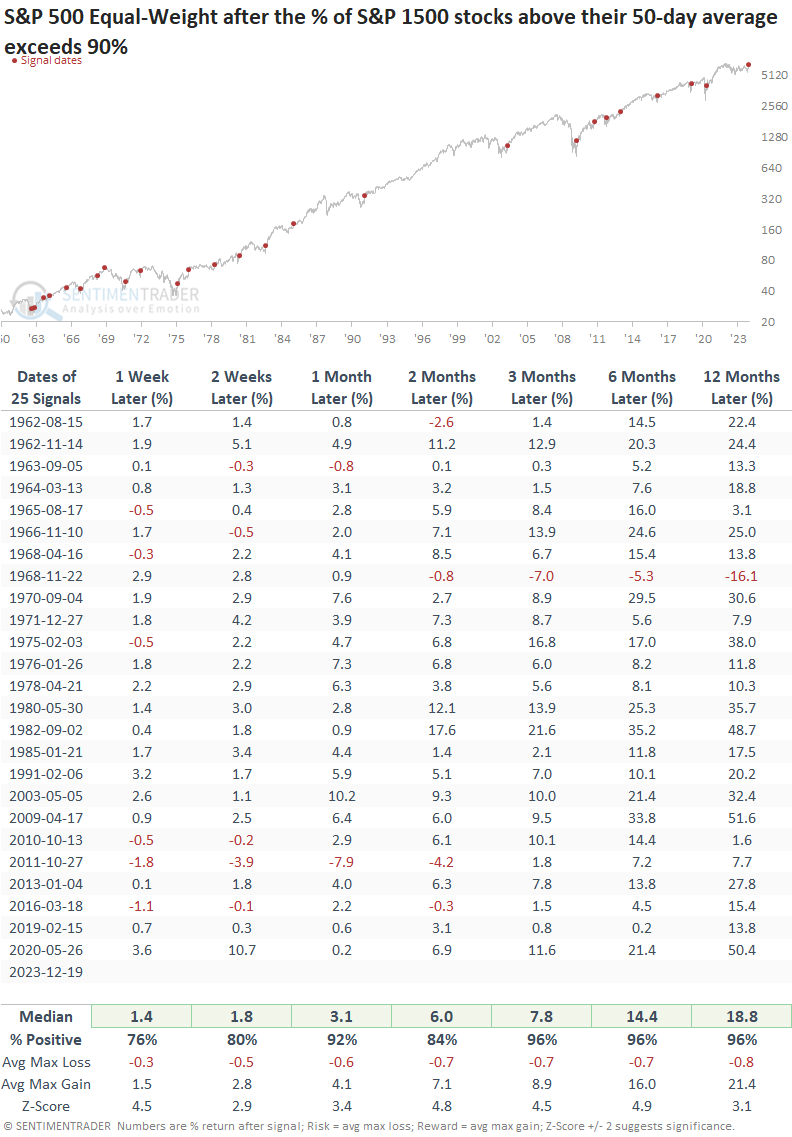
Relative comparison

Comparing the two index weighting methodologies suggests investors would have been better off holding a position in the equal-weighted index, which is now easily attainable via an ETF like RSP.

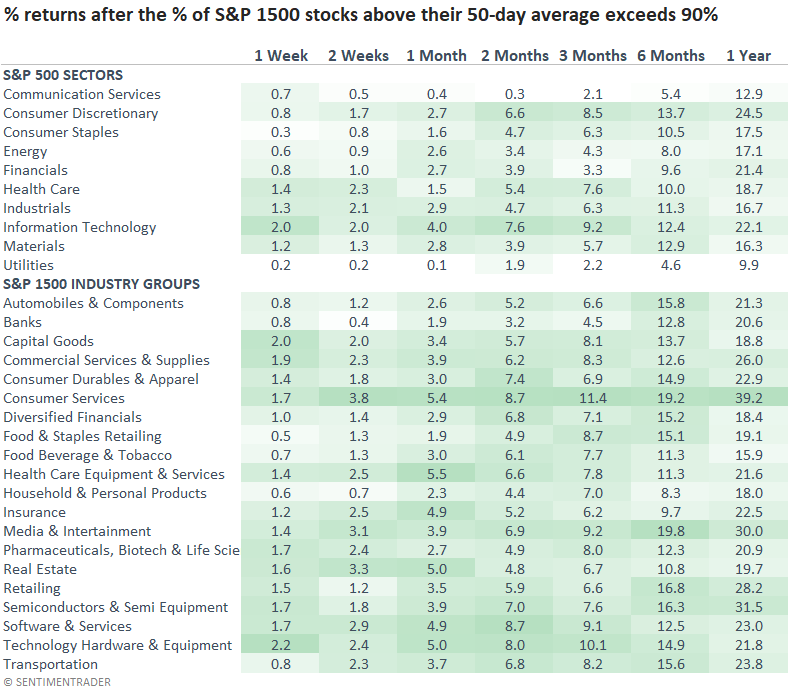
Sectors and Industries

While the outlook for all sectors and industries is bullish, cyclical-oriented stocks tend to outperform defensive ones.

What the research tells us...

A former money manager, George Chestnutt, once said, "The best forecaster of market action is the action of the market itself." With over 90% of S&P 1500 stocks in medium-term uptrends, the S&P 500's outlook is highly favorable. Mr. Market has spoken. Are you listening?

PRODUCTS
SentimenTrader
Trading Tools
Indicators & Data API
‍
Strategies & Scanner
‍
Research Reports
FREE
RESOUrCES
Simple Backtest
Calculator
Simple Seasonality
Calculator
The Kelly Criterion
Calculator
Sentiment Geo Map
‍
Public Research Reports
‍
Education
Sentiment Indicators
‍
Technical Indicators
‍
Pricing
Bundle pricing
‍
FAQ
‍
Announcements
‍
COMPANY
‍
About
‍
In the News
‍
Testimonials
‍
Client Success Stories
CONTACT
‍
General Inquiries
‍
Media Inquiries
‍
Financial Professionals Inquiries
‍
© 2026 Sundial Capital Research Inc. All rights reserved.
Setsail Marketing
TermsPrivacyAffiliate Program
Risk Disclosure: The information and tools provided are for research and analytical purposes only and are not intended as investment advice. Market analysis involves uncertainty, and outcomes may differ from expectations. Users should conduct their own due diligence and consider their individual circumstances before making any financial decisions. Past performance is not necessarily indicative of future results.

Hypothetical Performance Disclosure: Hypothetical performance results have many inherent limitations, some of which are described below. No representation is being made that any account will or is likely to achieve profits or losses similar to those shown; in fact, there are frequently sharp differences between hypothetical performance results and the actual results subsequently achieved by any particular trading program. One of the limitations of hypothetical performance results is that they are generally prepared with the benefit of hindsight. In addition, hypothetical trading does not involve financial risk, and no hypothetical trading record can completely account for the impact of financial risk of actual trading. for example, the ability to withstand losses or to adhere to a particular trading program in spite of trading losses are material points which can also adversely affect actual trading results. There are numerous other factors related to the markets in general or to the implementation of any specific trading program which cannot be fully accounted for in the preparation of hypothetical performance results and all which can adversely affect trading results.

Testimonial Disclosure: Testimonials appearing on this website may not be representative of other clients or customers and is not a guarantee of future performance or success.