
A Technology sector signal with a perfect record

Key points:
- The percentage of S&P 500 Technology stocks with a rising 200-day average cycled from < 5% to > 75%
- After similar reversals, Technology and the S&P 500 were higher a year later 100% of the time
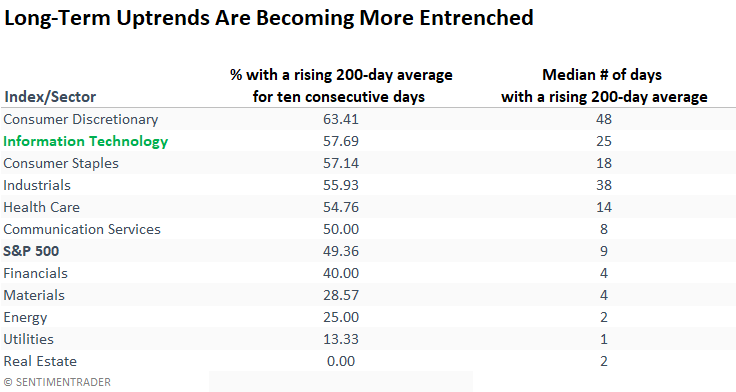
- Long-term uptrends are becoming more entrenched in growth-oriented sectors
A significant number of Technology stocks have a rising 200-day average
According to Bianco Research, "eight stocks are keeping the YTD gains in the S&P 500 positive, while the other 492 stocks are collectively down on the year."
While a handful of stocks dominate S&P 500 performance in the near term, long-term price trends for several sectors look bullish.
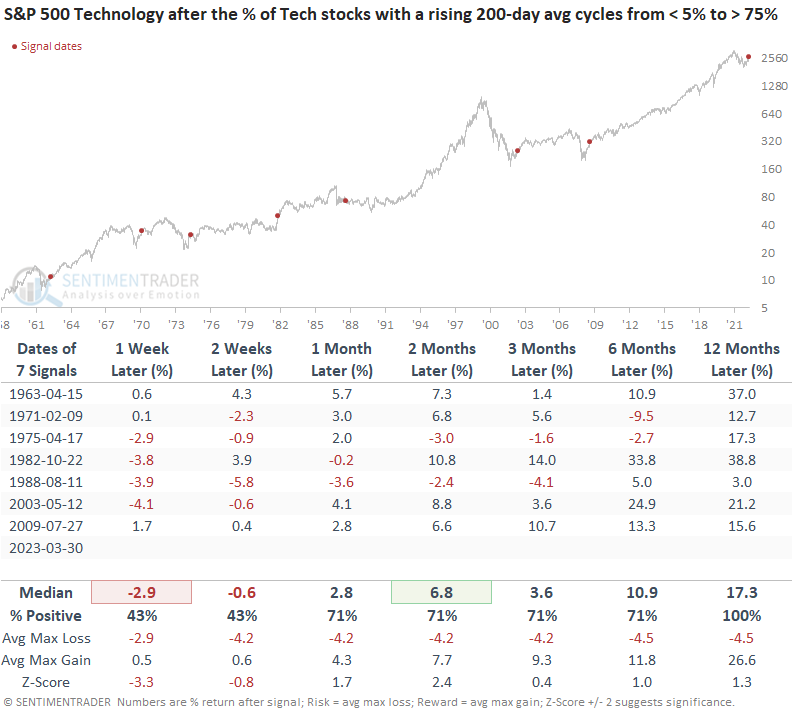
For only the eighth time since 1952, the percentage of S&P 500 Technology sector stocks with a rising 200-day moving average cycled from less than 5% to greater than 75%.
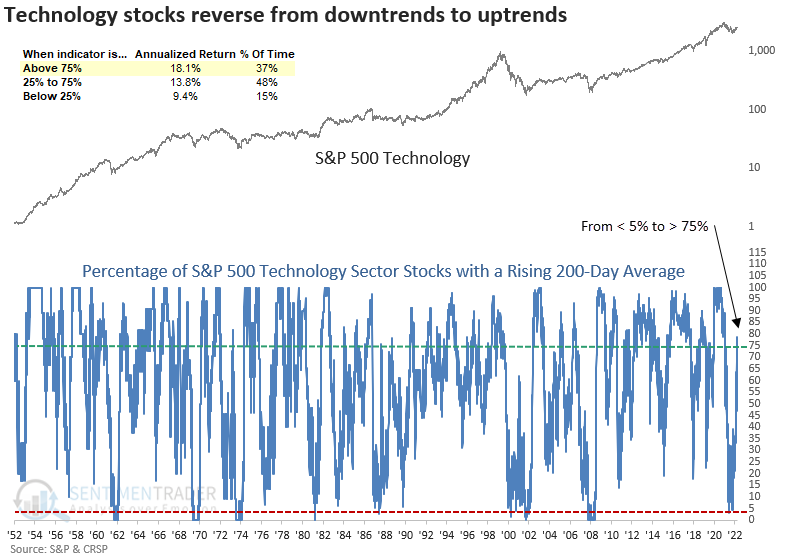
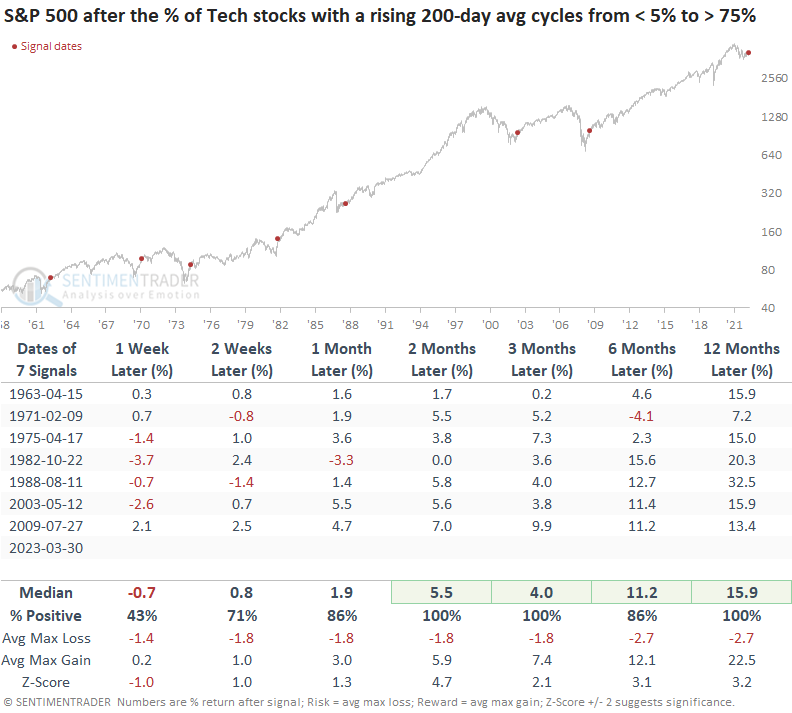
Similar reversals in price trends preceded bullish long-term results
When Technology stocks transition from long-term downtrends to uptrends, the sector tends to take a pause that refreshes a bullish backdrop. A year later, the industry was higher 100% of the time.
When I apply the signals to the S&P 500, consistency looks even better across all time frames. So, what's good for the Technology sector is good for the broad market.
Some context around the rising 200-day average
While Technology has over 78% of its members with a rising 200-day average, over 57% of those issues have an average that has risen for a minimum of ten consecutive days. And the median number of days with a rising 200-day is 25. So, under the surface, stocks have been improving for a while.
Concern for another day
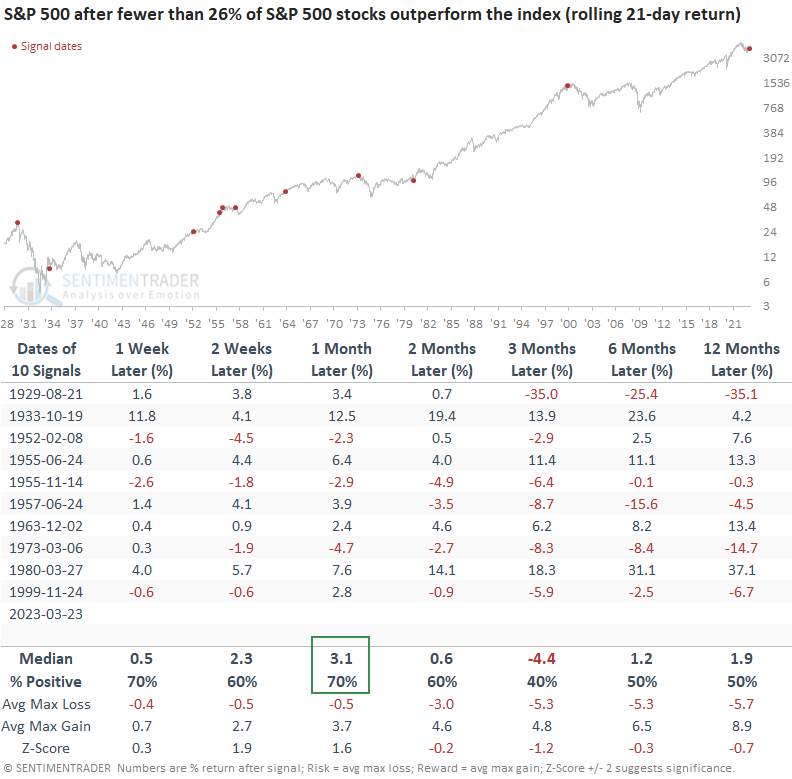
The recent outperformance by the Big Eight, which Bianco Research noted on social media, pushed the percentage of S&P 500 members outperforming the S&P 500 index to the lowest level since March 2000.
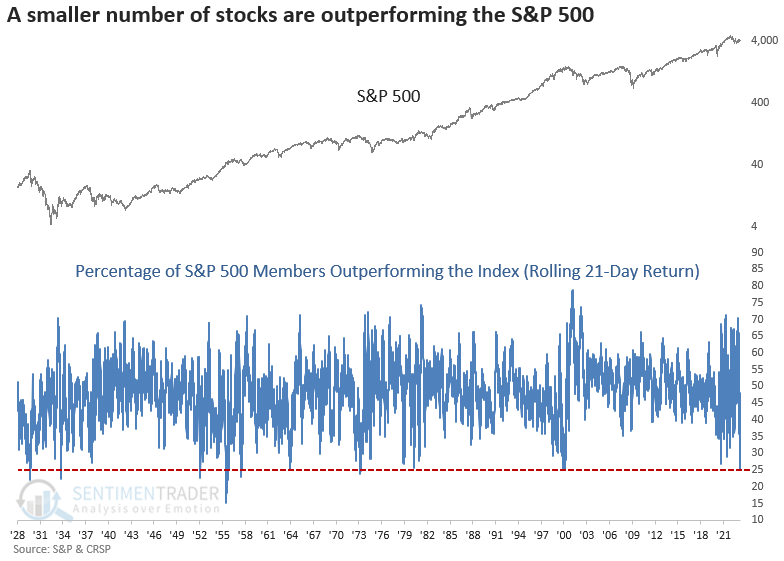
When the percentage of S&P 500 members outperforming the S&P 500 index falls below 26%, like now, the S&P 500 tends to rally over the next month. However, the 3-month time frame should be a friendly reminder that narrow markets eventually correct.
Most of the alarming signals, like 1929, 1973, and 1999, occurred close to an all-time high, which is not the case now.
What the research tells us...
Maintaining an allocation to a bullish sector in a challenging overall market environment is difficult, as we learned in 2022 with energy. Technology, a market underperformer in 2022, transitioned from a downtrend to an uptrend when the percentage of sector members with a rising 200-day average cycled from < 5% to > 75%. After similar signals, the sector struggled in the next few weeks, but the pause refreshed a bullish long-term backdrop. A year later, Technology was higher 100% of the time, and so was the S&P 500.