Data &
Technology
Research
Reports
Report Solutions
Reports Library
Actionable
Strategies
Free
Resources
Simple Backtest Calculator
Simple Seasonality Calculator
The Kelly Criterion Calculator
Sentiment Geo Map
Public Research Reports
Free Webinar
Pricing
Company
About
Meet Our Team
In the News
Testimonials
Client Success Stories
Contact
Log inLoginSign up
< BACK TO ALL REPORTS

A TCTM Risk Warning Model member triggers a risk-off signal

Dean Christians
2024-01-19
A TCTM Composite Risk Warning Model component triggered a new risk-off signal for stocks. After similar alerts, the S&P 500 struggled over the following two months. However, the overall model remains well below the signal threshold for a broad composite warning.

Key points:

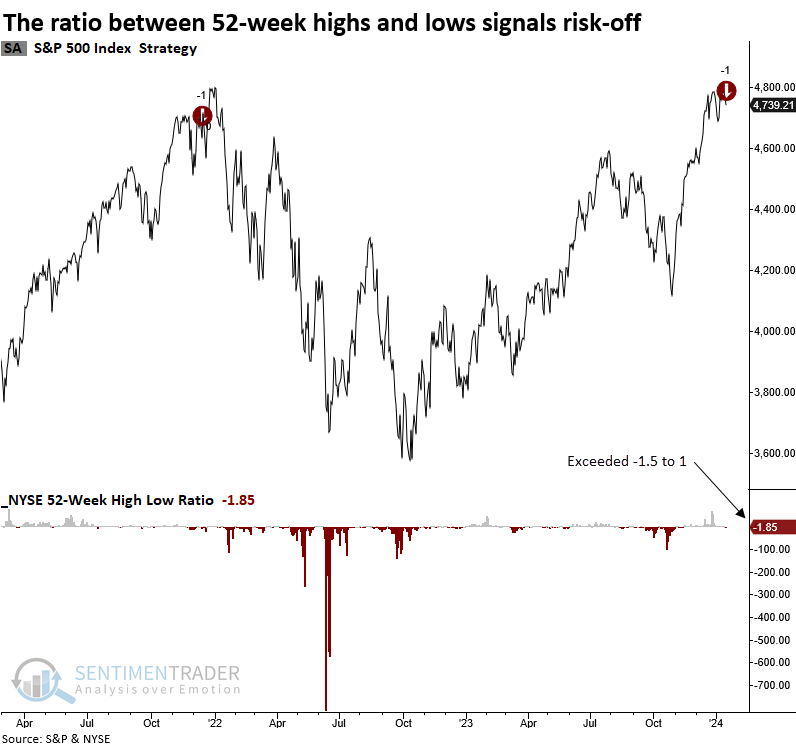
  • The ratio between 52-week highs and lows on the NYSE exceeded -1.5 to 1, two sessions from a high 
  • Similar skews in highs versus lows preceded negative returns for the S&P 500 over the subsequent two months
  • The TCTM Composite Risk Warning Model signal count increased to 10%

NYSE 52-week lows outpaced highs near an annual high

A model that monitors NYSE 52-week highs relative to lows exceeded a ratio of -1.5 to 1, with the S&P 500 only two days removed from an annual high, triggering a risk-off signal for a member in the TCTM Risk Warning Model. 

The previous alert occurred in December 2021, three weeks before the peak in the S&P 500 on 2022-01-03. However, that signal was accompanied by several other risk-off signals from members in the Composite Risk Warning Model, culminating in a timely composite signal on 2022-01-13. 

While this alert could be an isolated event, it raises a yellow flag regarding the sustainability of broad market participation that began last Autumn.  

Comparable skews in 52-week highs versus lows preceded negative returns

If, within two days of hitting an annual high, the ratio of NYSE 52-week highs to lows exceeds -1.5 to 1, the world's most benchmarked index displayed negative returns and unfavorable win rates over the subsequent two months. While the S&P 500 eventually recovered, the outlook from three to twelve months later underperformed relative to historical trends.

A single arrow is easily broken, but not ten in a bundle - Japanese proverb

For a Composite Risk Warning Model alert to activate, the composite signal count must hit a minimum threshold of 50%, a currently unmet condition. In May 2023, the model reached 20%, as a brief consolidation within the overall context of a bottoming process underscored a subpar breadth environment. 

It's common to see the signal count increase to levels below the trigger threshold. Typically, it denotes sector rotation.

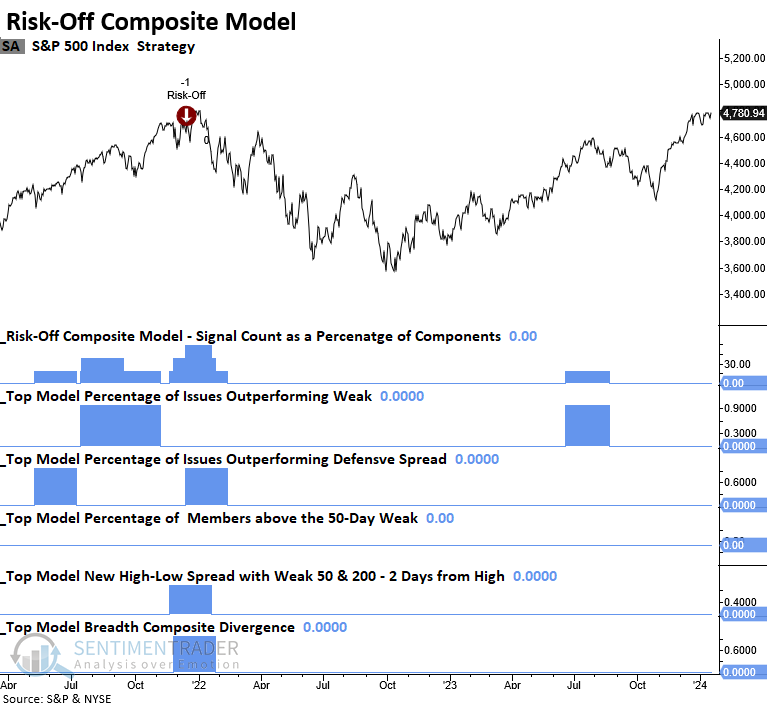
A secondary risk-off composite

The Risk-Off Composite Model, which is not a TCTM component, can be found at the bottom of the TCTM Live page on the website. I use it as a secondary measure to manage risk.

This model currently shows a signal count of 0%, indicating an absence of breadth-based warnings.

What the research tells us...

Starting last Fall, we highlighted numerous breadth-based studies suggesting a broadening in market participation. Unfortunately, more and more signs, like the 52-week high-low ratio signal, indicate that the environment could be falling right back into the first half of the 2023 scenario, i.e.,  it's growth-oriented technology stocks working and not much else. While a participation problem is not ideal, there's always a bull market somewhere. Until the weight of the evidence suggests otherwise, stay the course with allocations to the strongest sectors, industries, and stocks.  

Sorry, you don't have access to this report

Upgrade your subscription plan to get access
Go to Dasboard
DATA &
TECHnologies
IndicatorEdge
‍
BackTestEdge
‍
Other Tools
‍
DataEdge API
RESEARCH
reports
Research Solution
‍
Reports Library
‍
actionable
Strategies
Trading Strategies
‍
Smart Stock Scanner
‍
FREE
RESOUrCES
Simple Backtest
Calculator
Simple Seasonality
Calculator
The Kelly Criterion
Calculator
Sentiment Geo Map
‍
Public Research Reports
‍
Free Webinar
COMPANY
‍
About
‍
Meet our Team
‍
In the News
‍
Testimonials
‍
Client Success Stories
Pricing
Bundle pricing
‍
Announcements
‍
FAQ
© 2024 Sundial Capital Research Inc. All rights reserved.
Setsail Marketing
TermsPrivacyAffiliate Program
Risk Disclosure: Futures and forex trading contains substantial risk and is not for every investor. An investor could potentially lose all or more than the initial investment. Risk capital is money that can be lost without jeopardizing ones’ financial security or life style. Only risk capital should be used for trading and only those with sufficient risk capital should consider trading. Past performance is not necessarily indicative of future results.

Hypothetical Performance Disclosure: Hypothetical performance results have many inherent limitations, some of which are described below. No representation is being made that any account will or is likely to achieve profits or losses similar to those shown; in fact, there are frequently sharp differences between hypothetical performance results and the actual results subsequently achieved by any particular trading program. One of the limitations of hypothetical performance results is that they are generally prepared with the benefit of hindsight. In addition, hypothetical trading does not involve financial risk, and no hypothetical trading record can completely account for the impact of financial risk of actual trading. for example, the ability to withstand losses or to adhere to a particular trading program in spite of trading losses are material points which can also adversely affect actual trading results. There are numerous other factors related to the markets in general or to the implementation of any specific trading program which cannot be fully accounted for in the preparation of hypothetical performance results and all which can adversely affect trading results.

Testimonial Disclosure: Testimonials appearing on this website may not be representative of other clients or customers and is not a guarantee of future performance or success.