
A TCTM Risk Warning Model component triggered a risk-off alert

Key points:
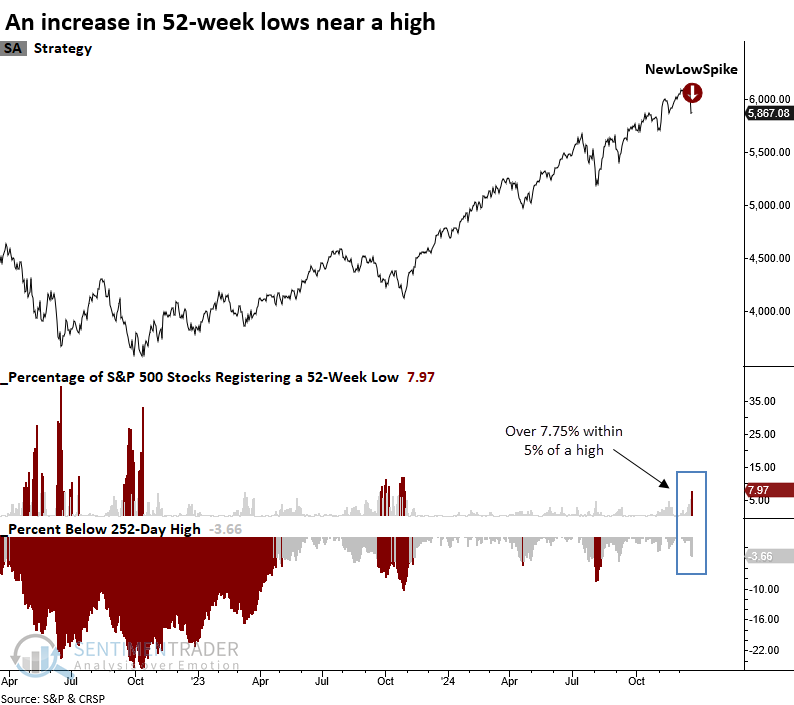
- Over 7.75% of S&P 500 stocks registered a 52-week low, with the index less than 5% below a high
- Similar expansions in lows near a high produced a negative outlook for the S&P 500
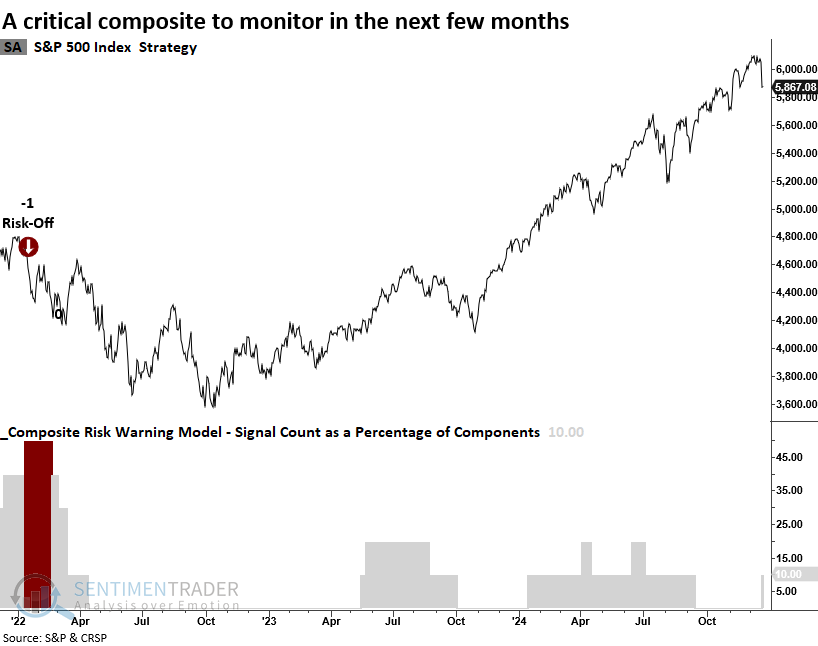
- With the new alert, the TCTM Risk Warning Model signal count increased to 10%
The market breadth environment falters, pointing to increased risks
As a strong advocate for a weight-of-the-evidence approach that leverages composite models to improve the odds of success, I rely on a range of indicators. However, if I had to choose one indicator to assess risk in a bull market, it would be 52-week lows. When stock indexes advance and 52-week lows increase, it's a sign that all is not well with the internal condition of the market, and the uptrend could falter.
On Thursday, a TCTM Risk Warning Model component triggered a risk-off alert when more than 7.75% of S&P 500 stocks registered a 52-week low, with the index less than 5% below a 252-day high.
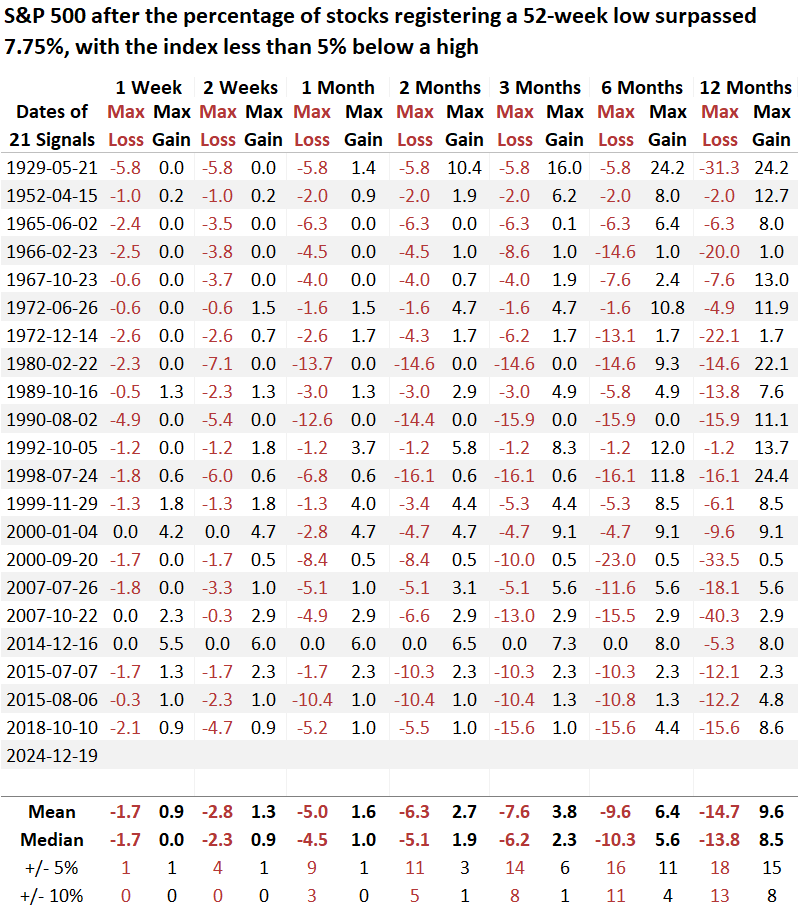
The previous signal was triggered in October 2018. Over the subsequent three months, the S&P 500 experienced a max loss of -15.6%.
Similar expansions in 52-week lows preceded a negative outlook for stocks
Whenever more than 7.75% of S&P 500 stocks hit a 52-week low with the index no more than 5% below a 252-day high, the world's most benchmarked index demonstrated an unfavorable outlook over the subsequent year. The average maximum loss exceeded the maximum gain across all time frames, and returns were significantly worse than random returns in all but one horizon.
The 2014 signal is an interesting analogy as it occurred in December, like now, and marked an immediate bottom. Over the next six months, the S&P 500 rallied 7.5%. However, that rally faltered, and stock indexes flatlined before embarking on a sizable correction in 2015-16.
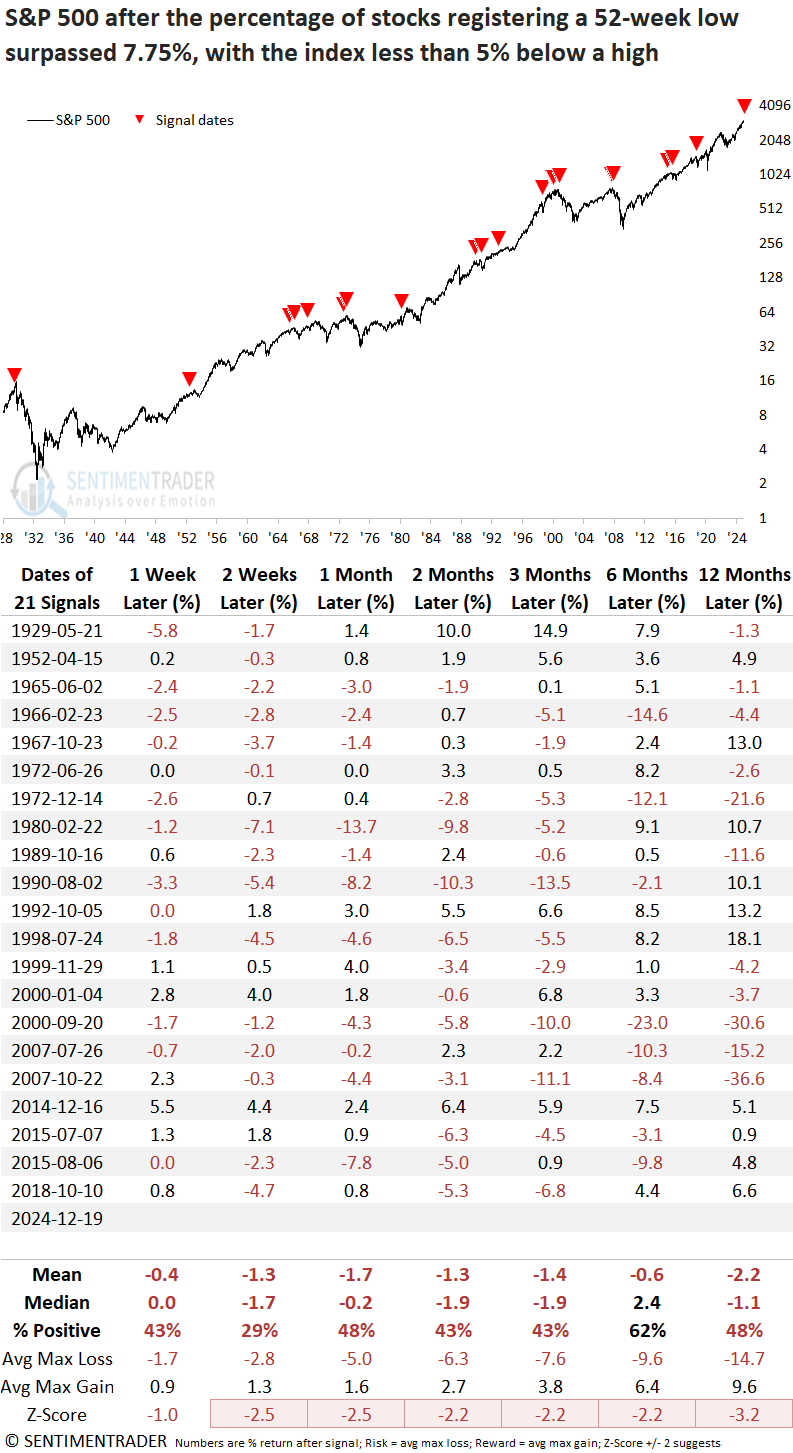
Over the next year, 13 of 21 signals experienced a maximum loss more significant than the maximum gain, with the maximum loss exceeding 10% in the same number of cases.
What's driving the expansion in new lows
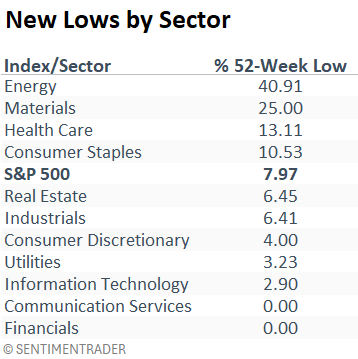
As noted in previous reports, the deterioration in market breadth indicators continues to be primarily influenced by defensive and commodity-focused sectors, as demonstrated in the table below, highlighting 52-week lows.
It's crucial to note that Financials, the most critical sector to monitor, did not experience any new lows on Thursday. This absence is a positive sign, offering hope amidst broader signals suggesting the uptrend could falter.
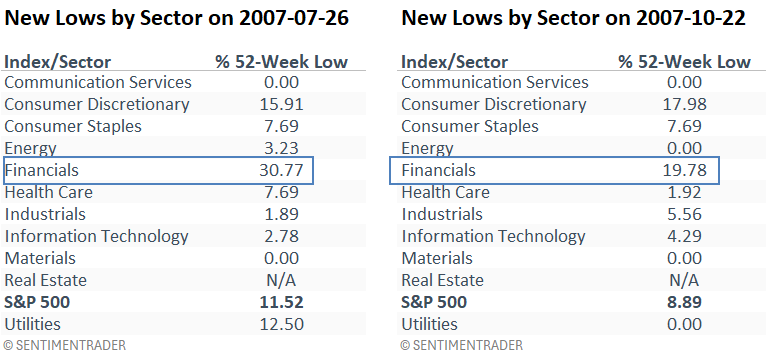
Historical perspective 2007 market top
A 52-week low warning occurred twice around the 2007 peak, highlighting severe pressure within the Financials sector-a clear indication of systemic risk. The Consumer Discretionary sector also experienced a sharp rise in new lows, signaling significant challenges for industries reliant on consumer spending.
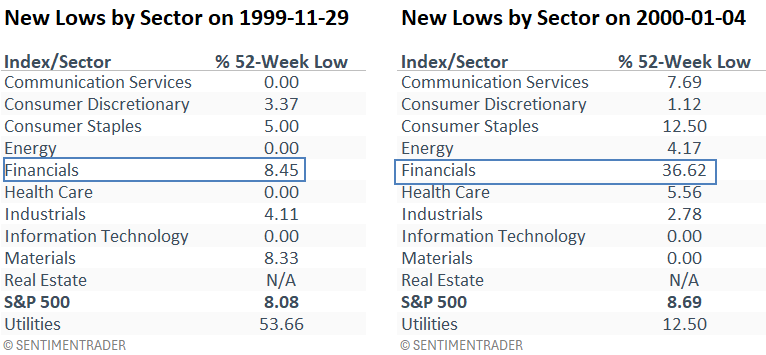
Historical perspective 2000 market top
A 52-week low warning occurred two times around the 2000 peak. Once again, financials signaled all was not well, leading to the broad market peak in March 2000.
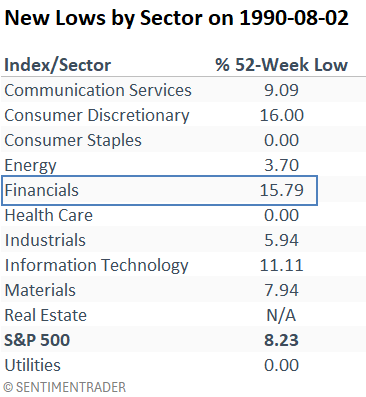
Historical perspective 1990 market top
Is the pattern becoming more apparent to you? Focus on 52-week lows, particularly when the financial sector is at the forefront of the expansion.
TCTM Risk Warning Model
With just one component of the risk warning composite signaling an alert, there's no clear evidence of a systemic participation problem.
However, monitoring this model closely in the coming months would be prudent.
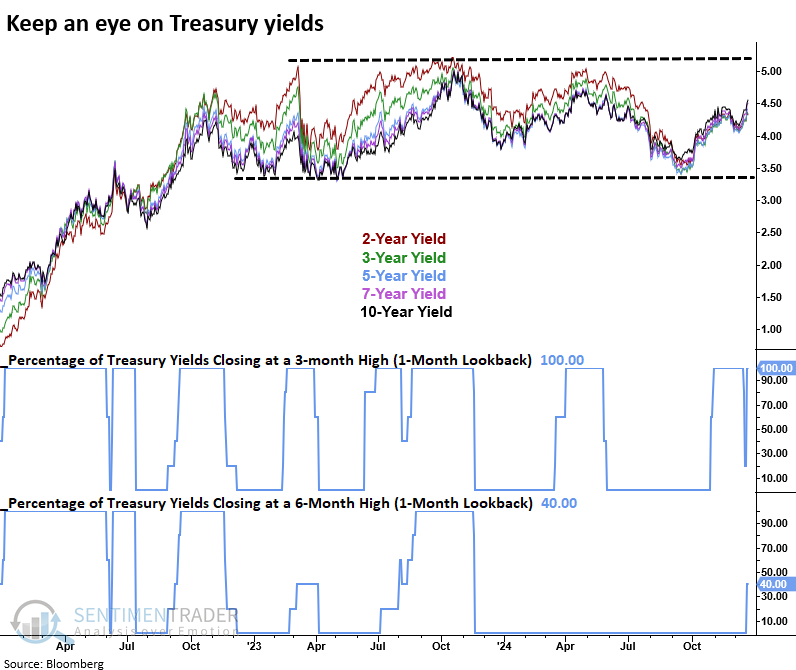
Treasury yields
Treasury yields remain a crucial factor to monitor, particularly in light of the latest Fed meeting. A move toward the upper end of their range, as depicted in the chart below, could intensify pressure on specific stock groups, further straining the already weakening market breadth backdrop.
What the research tells us...
The first significant warning shot has been fired, suggesting that all is not well with the uptrend in stock indexes. The next few months will be critical in determining whether this was a one-off instance or something more systemic, potentially leading to a significant counter-trend drawdown. Comparable increases in 52-week lows near a high have seen the S&P 500 experiencing a challenging environment over the subsequent year. Risks are increasing; stay alert.