
A TCTM Composite Washout Model member triggers a new alert

Key points:
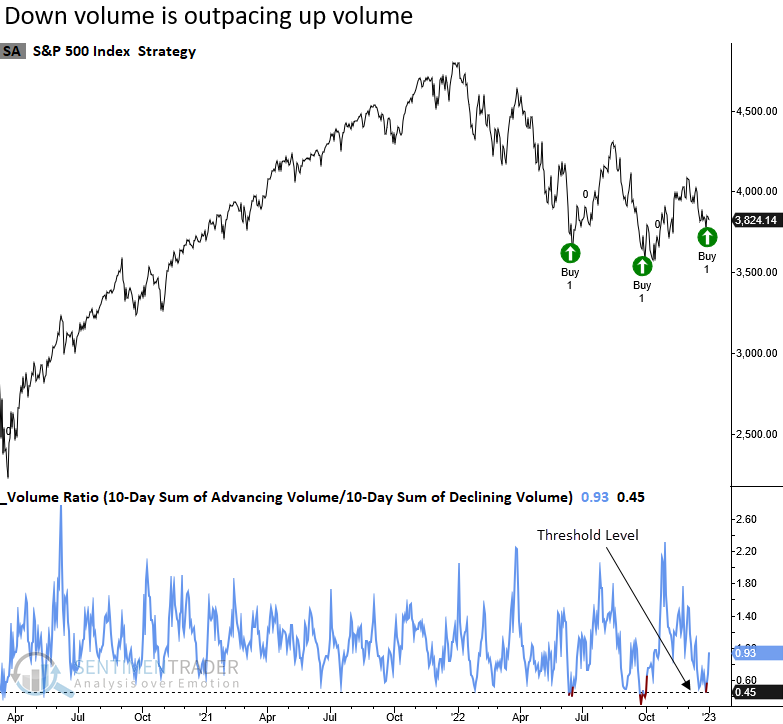
- A ratio between S&P 500 advancing and declining volume declined to a historically low level
- The lopsided volume skew triggered a new alert for a Composite Washout Model member
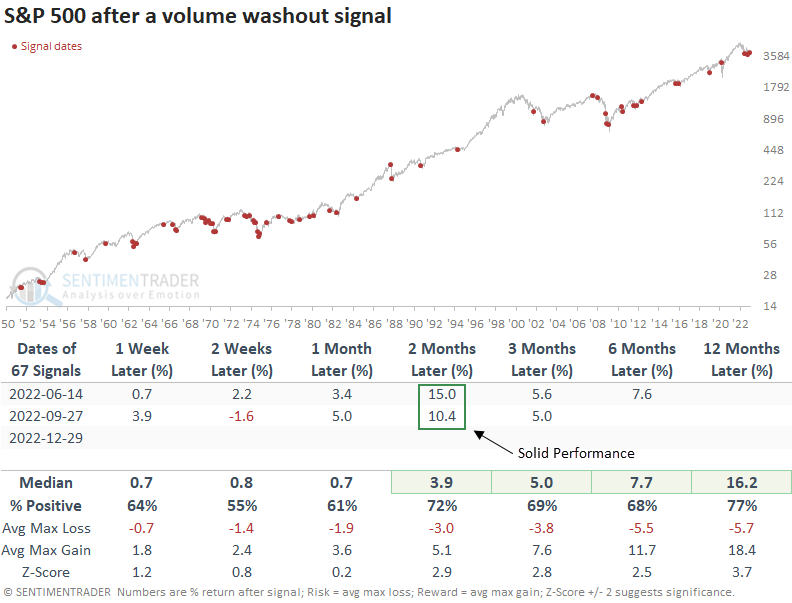
- The S&P 500 rallied 72% of the time over the next two months after other signals
The up/down volume skew suggests a washed-out market
A new signal from a voting member in the Composite Washout Model registered a new alert.
The volume washout signal identifies when the 10-day sum of advancing volume relative to the 10-day sum of declining volume for the S&P 500 falls below 0.45 and increases by 0.01.
The two previous signals in 2022 led to substantial multi-month rallies. However, we need to be mindful that both of those alerts occurred as the S&P 500 was recording a 1-year low, which is not the case now.
Similar volume ratio signals preceded solid results across medium-term time frames
This model generated a signal 67 other times over the past 72 years. After the others, future returns, win rates, and z-scores were excellent from two to twelve months later. As with most standalone capitulation indicators, drawdowns in long, drawn-out bear markets can be gut-wrenching, which is why I use a composite.
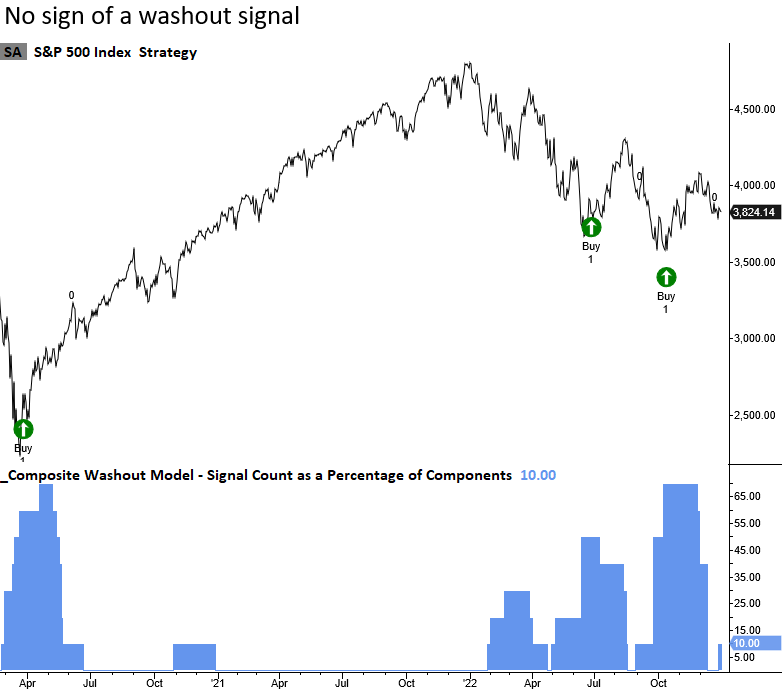
The CWM uses a weight-of-the-evidence approach to identify a mean reversion opportunity
The TCTM Composite Washout Model remains well below the threshold for a new buy signal. The previous alerts in 2022 provided an excellent opportunity for a multi-month countertrend trade.
What the research tells us...
When the ratio between advancing and declining volume for the S&P 500 falls to a historically low level, an oversold condition suggests a mean reversion opportunity exists. Similar setups to what we're seeing now have preceded rising S&P 500 prices, especially across medium-term time frames. Of course, one should never rely upon a single indicator, which is why I created the Composite Washout Model. With a CWM signal count of only 10%, the weight of the evidence suggests a fat pitch similar to June and October 2022 is unlikely in the near term.