
A Tale of Two Markets in Spring

"There is Season, turn, turn, turn." OK, truth be told, as a member of the classic rock generation I never really liked that song. But it is pretty catchy and it is absolutely the perfect segue into today's topic, which will compare and contrast the stark differences in the performance of two different commodity markets over the same time period.
Soybeans
Soybean futures have been on a tear since about mid-August 2020. Subjective, knee-jerk reaction would suggest that there is no way this rally can continue. And maybe it won't. But given that January is followed by February, March and April a strong argument can be made for not betting against beans anytime soon.
The chart below uses a soybeans futures price data series from Bloomberg that attempts to create a "continuous" futures contract, i.e., one that attempts to replicate the return that a trader might have experienced if continuously trading the spot month of beans. While all results are therefore "hypothetical" the key feature of what we are going to look at next is not the exact dollar amount, but the overarching long-term tendency.
The chart below displays the hypothetical dollar gain or loss that a trader might have experienced had he or she held long a 1-lot position in soybean futures ONLY during the months of February, March and April every year since 1960.
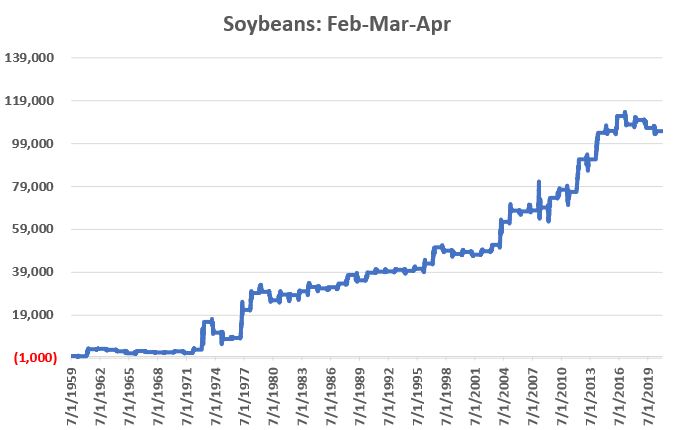
The most compelling aspect to the chart above is captured in:
Jay's Trading Maxim #54: The most important acronym for traders is LLUR, which stands for "Lower Left to Upper Right". That's how we want our equity curve to move. Whatever we trade and however we trade it, as long as we have LLUR things are good.
The chart above clearly demonstrates the desired LLUR tendency. The good news then is that there appears to be a clear positive seasonal tendency for beans in spring. The bad news is that despite this clearly favorable tendency, the fact remains, there are no "sure things" in the markets. Consider the facts and figures in the table below
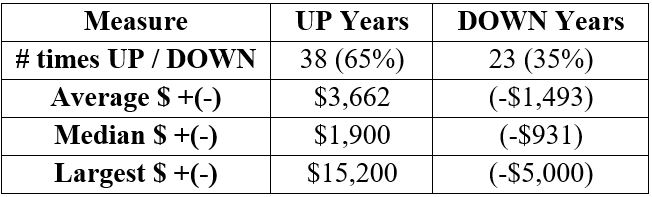
The bottom line: over time a properly capitalized trader has the potential to profit from a long position in soybeans during February through April. But on a year-to-year basis the results can be very random as fundamental supply-and-demand factors can vary widely.
For non-futures traders, one alternative is the ETF ticker SOYB, which is intended to track the price of soybean futures. Via this ETF a trader can enter a position in soybeans without trading futures contracts. Traders should be aware that SOYB is not heavily traded.
Sugar
Sugar has also been in a pretty solid uptrend since May of 2020. Will this trend continue? Here the seasonal tendency paints a potentially more ominous picture. The chart below uses a sugar futures price data series also from Bloomberg that attempts to create a "continuous" futures contract, i.e., in sugar futures. Once again, while all results are therefore "hypothetical" the key feature of what we are going to look at next is not the exact dollar amount, but the overarching long-term trend.
The chart below displays the hypothetical dollar gain or loss that a trader might have experienced had he or she held long a 1-lot position in sugar futures ONLY during the months of February, March and April every year since 1961.
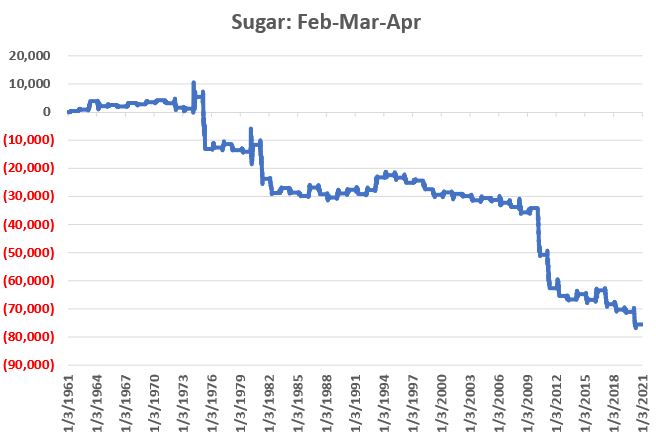
This equity curve chart for sugar paints a very different picture than the one above for soybeans. The sugar equity curve is essentially the opposite of LLUR. Yet here too the reality is that it is a mistake to automatically assume that sugar will automatically perform poorly during February through April "this time around." While the overall results have been fairly abysmal the fact remains that during 40% of all years since 1961 sugar futures traded higher between the end of January and the end of April. So you must be aware that a knee-jerk "sugar goes down in spring" assumption can get you in trouble.
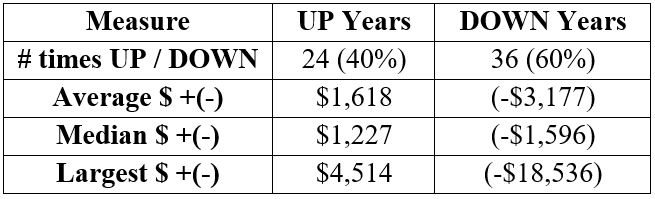
The key factor here is that the bad years were "very bad." While the largest Feb-Apr gain was +$4,514, on four occasions (1975, 1981, 2010, 2011) sugar lost in excess of -$11,000 during this three-month period.
The bottom line: over time a properly capitalized trader has the potential to profit from a short position in sugar during February through April. But once again, on a year-to-year basis the results can be very random.
For non-futures traders, one alternative is the ETF ticker CANE, which is intended to track the price of sugar futures. A trader wishing to play the short side of the sugar market without trading futures contracts could consider selling short shares of CANE as an alternative. Before doing so a trader should carefully consider the unique risks of selling short a relatively thinly traded ETF, the requisite margin requirements and the potential for unlimited risk.
Please remember that the purpose of this piece is not to recommend that anyone rush out and trade beans or sugar, especially without first realistically assessing the potential risks. The real purpose is to make you aware of potential opportunities that very few traders will ever know exist.
As always, opportunity is where you find it.