Products
SentimenTrader Trading Tools
‍
Backtest Engine
My Trading Toolkit
Correlation Analysis
Seasonality
Market Prediction
Indicators & Data API
‍
Proprietary Indicators & Charts
Market Data API
Strategies & Scanner
‍
50+ Trading Strategies
Smart Stock Scanner
Smart Option Scanner
Research Reports
‍
Research Solutions
Reports Library
Free Resources
Simple Backtest Calculator
Simple Seasonality Calculator
The Kelly Criterion Calculator
Sentiment Geo Map
Public Research Reports
Education
Sentiment Indicators
Technical Indicators
Pricing
Company
About
In the News
Testimonials
Client Success Stories
Contact
Log inLoginSign up
< BACK TO ALL REPORTS

A tactical trade opportunity in crude oil

Dean Christians
2023-04-12
Price and volatility measures for crude oil recently reversed, triggering bullish buy signals for the commodity. After similar setups, the case for a tactical trade over the next few months looks compelling, despite a long-term downtrend in oil.

Key points:

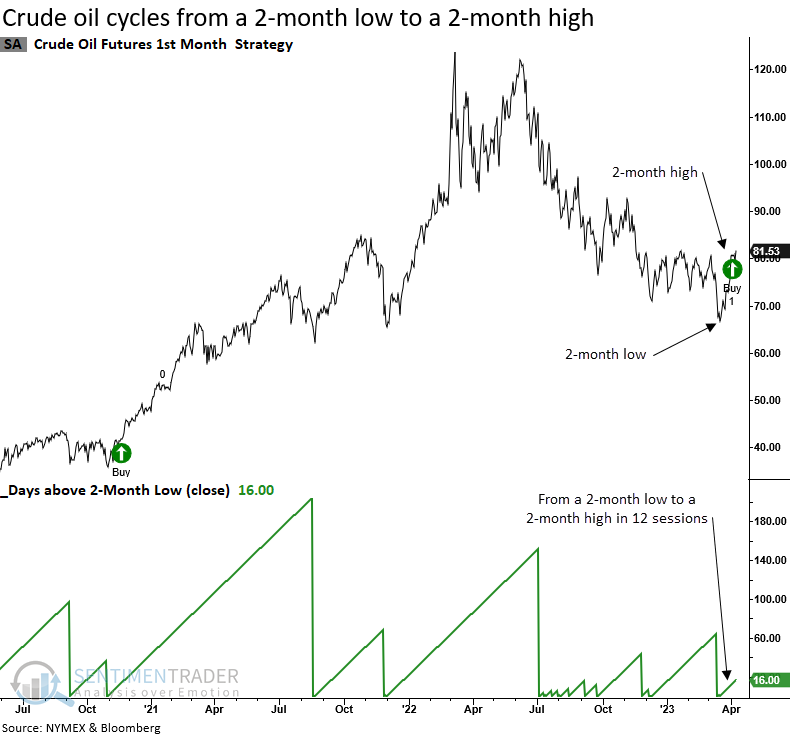
  • Crude oil cycled from a 2-month low to a 2-month high in only 12 trading sessions
  • After similar reversals, the commodity showed strong results over the next two months
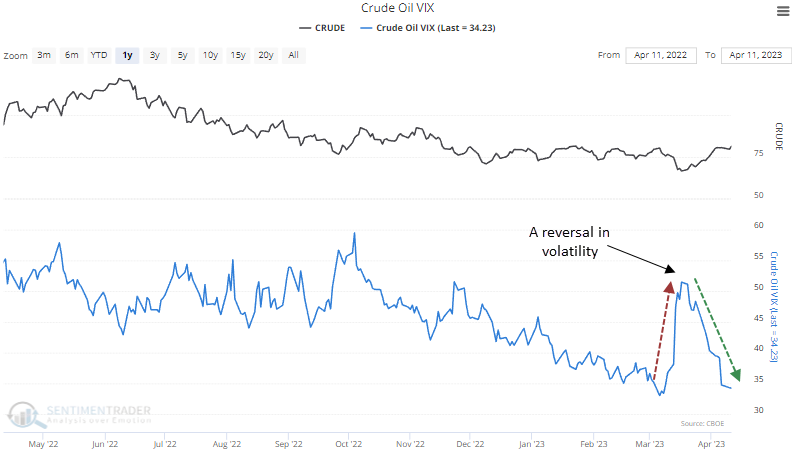
  • The Volatility Index for crude oil reversed from the upper end to the lower end of its recent range
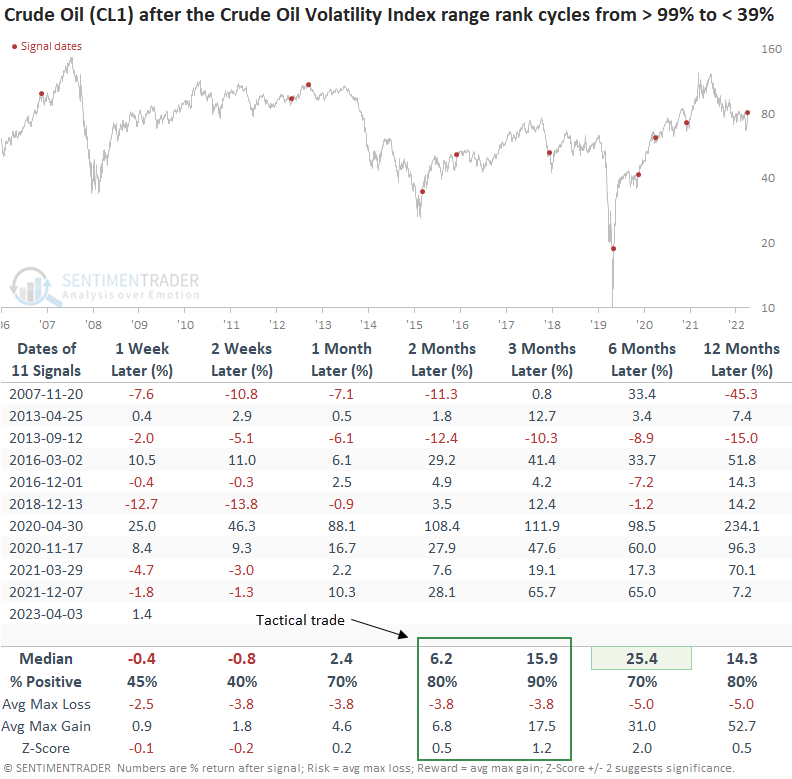
  • After similar volatility-based signals, oil was higher 90% of the time over the next three months

A reversal in price and volatility indicators suggests a tactical trade opportunity 

Crude oil remains firmly in a long-term downtrend after declining 46% from its peak in March 2022 to the recent low in March 2023. Slowing economic growth and the strategic oil reserve drawdown have weighed on the commodity. 

However, some new and interesting developments suggest the recent counter-trend rally in oil could continue.  

A bullish reversal in the price of crude oil

For only the 19th time since 1984, crude oil futures (CL1) reversed from a 2-month low to a 2-month high in fewer than 20 trading sessions. 

The previous signal in November 2020 led to a substantial rally. 

Similar reversals in the price of crude oil suggest a tactical opportunity

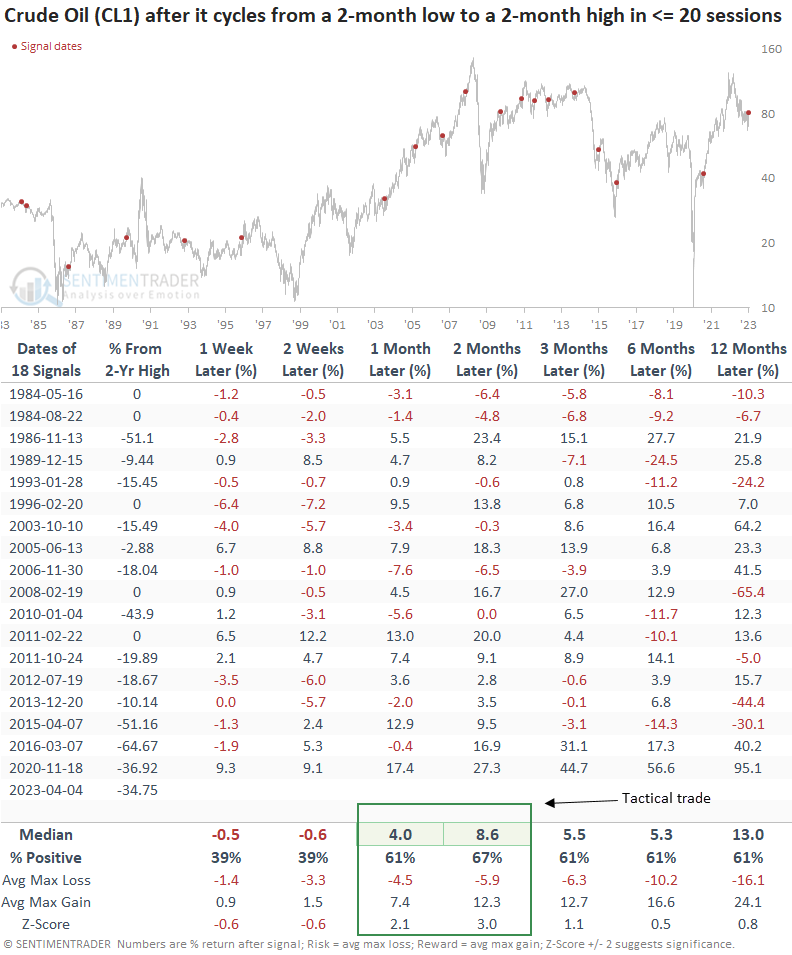
When oil cycles from a 2-month low to a 2-month high in 20 sessions or fewer, the commodity tends to consolidate the gains over the next few weeks. After the brief pause, the one and two-month time horizons show excellent returns, win rates, and z-scores.

Results look even more favorable when a signal occurs with crude oil down more than 30% from a 2-year high, which is the case now. Two months later, oil was higher 80% of the time, with a median gain of 16.9%.

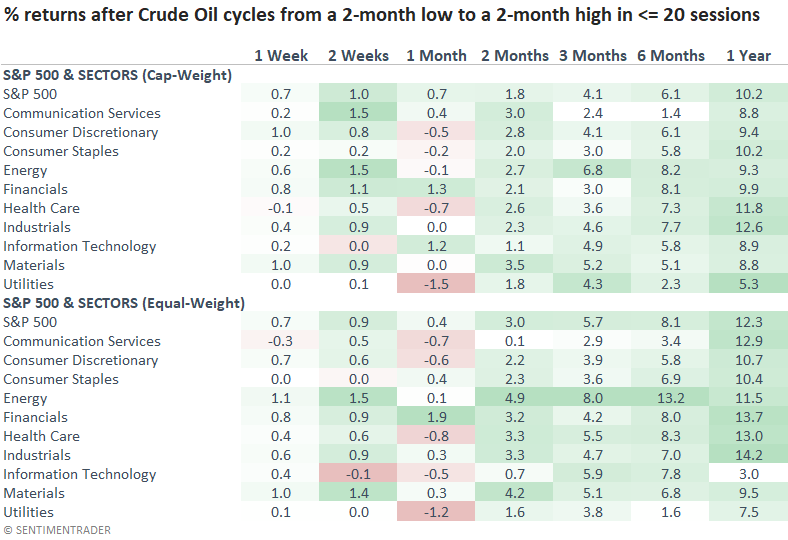
The reversal in oil hurts most sectors, including energy, over the next month. After the initial adjustment to higher energy costs, stocks resume an upward bias. The sweet spot for the energy sector comes in the three-month time frame.

A bullish reversal in the Volatility Index for crude oil

The Crude Oil Volatility Index (OVX), equivalent to the CBOE's Volatility Index (VIX) for the S&P 500, surged higher and subsequently reversed lower, triggering a buy signal for crude oil. 

I apply an 84-day range rank to the Crude Oil VIX. After the range rank increases above a reset level of 99%, the system generates a buy signal when the indicator falls below 39%, and oil exhibits positive price momentum.

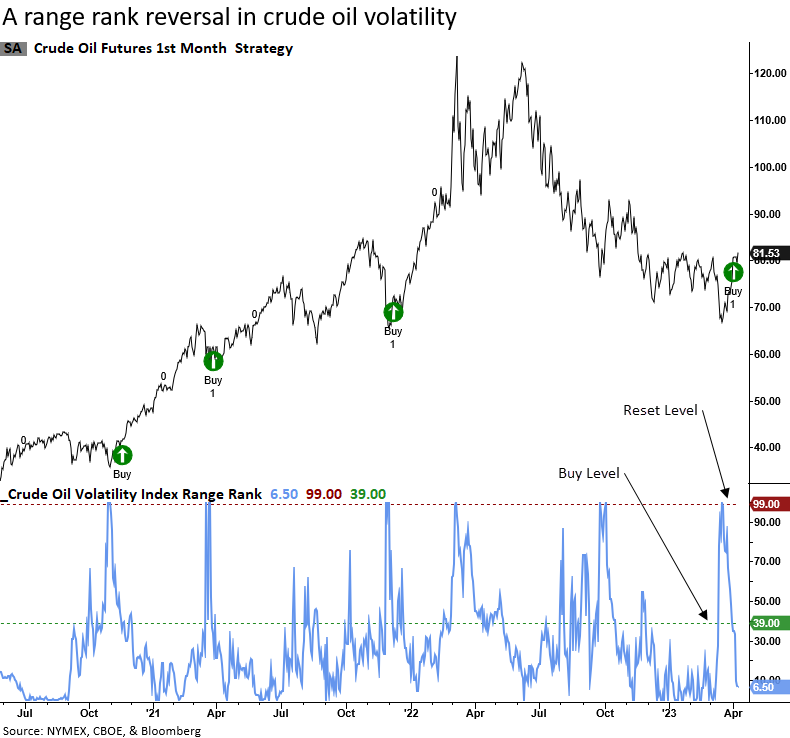
Like the price reversal signal, crude oil pauses for a few weeks after the volatility range rank alert. Once the pause ends, oil takes off with excellent results in the two and three-month windows.  

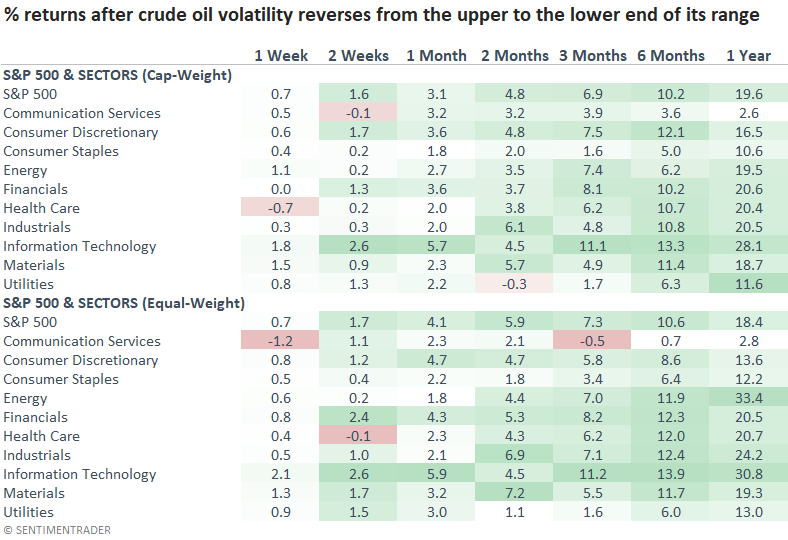
The reversal in the Crude Oil Volatility Index had very little if any, impact on stocks. We must remember the volatility series has a limited history and that most of the study period occurred in a bull market for stocks.

Interestingly, the energy sector lagged behind the broad market across most time frames.

What the research tells us...

Crude oil remains firmly in a bearish long-term downtrend. Still, the recent reversal in price and volatility measures for oil suggests the counter-trend rally that started in March can continue over the next few months. A tactical trade looks compelling as the recent breakout from a multi-month base provides plenty of support to define our risk reward. 

PRODUCTS
SentimenTrader
Trading Tools
Indicators & Data API
‍
Strategies & Scanner
‍
Research Reports
FREE
RESOUrCES
Simple Backtest
Calculator
Simple Seasonality
Calculator
The Kelly Criterion
Calculator
Sentiment Geo Map
‍
Public Research Reports
‍
Education
Sentiment Indicators
‍
Technical Indicators
‍
Pricing
Bundle pricing
‍
FAQ
‍
Announcements
‍
COMPANY
‍
About
‍
In the News
‍
Testimonials
‍
Client Success Stories
CONTACT
‍
General Inquiries
‍
Media Inquiries
‍
Financial Professionals Inquiries
‍
© 2026 Sundial Capital Research Inc. All rights reserved.
Setsail Marketing
TermsPrivacyAffiliate Program
Risk Disclosure: The information and tools provided are for research and analytical purposes only and are not intended as investment advice. Market analysis involves uncertainty, and outcomes may differ from expectations. Users should conduct their own due diligence and consider their individual circumstances before making any financial decisions. Past performance is not necessarily indicative of future results.

Hypothetical Performance Disclosure: Hypothetical performance results have many inherent limitations, some of which are described below. No representation is being made that any account will or is likely to achieve profits or losses similar to those shown; in fact, there are frequently sharp differences between hypothetical performance results and the actual results subsequently achieved by any particular trading program. One of the limitations of hypothetical performance results is that they are generally prepared with the benefit of hindsight. In addition, hypothetical trading does not involve financial risk, and no hypothetical trading record can completely account for the impact of financial risk of actual trading. for example, the ability to withstand losses or to adhere to a particular trading program in spite of trading losses are material points which can also adversely affect actual trading results. There are numerous other factors related to the markets in general or to the implementation of any specific trading program which cannot be fully accounted for in the preparation of hypothetical performance results and all which can adversely affect trading results.

Testimonial Disclosure: Testimonials appearing on this website may not be representative of other clients or customers and is not a guarantee of future performance or success.