Products
SentimenTrader Trading Tools
‍
Backtest Engine
My Trading Toolkit
Correlation Analysis
Seasonality
Market Prediction
Indicators & Data API
‍
Proprietary Indicators & Charts
Market Data API
Strategies & Scanner
‍
50+ Trading Strategies
Smart Stock Scanner
Smart Option Scanner
Research Reports
‍
Research Solutions
Reports Library
Free Resources
Simple Backtest Calculator
Simple Seasonality Calculator
The Kelly Criterion Calculator
Sentiment Geo Map
Public Research Reports
Education
Sentiment Indicators
Technical Indicators
Pricing
Company
About
In the News
Testimonials
Client Success Stories
Contact
Log inLoginSign up
< BACK TO ALL REPORTS

A sudden surge in wants over needs

Jason Goepfert
2023-01-31
During the latest bear market, investors greatly favored relatively safe Staples stocks over riskier Discretionary ones. That changed in a big way over the past month, with the Discretionary/Staples Ratio surging by nearly 20%. Similar changes in behavior typically preceded more gains for the ratio, as well as the S&P 500.

Key points:

  • Over the past month, Discretionary stocks have surged relative to Staples
  • The quick about-face comes after a prolonged and severe decline in the ratio between the two
  • When investors have suddenly switched back to "wants" from "needs," it tended to precede gains

Investors have suddenly switched from needs to wants

There are many ways to gauge whether investors are in a risk-on versus risk-off mood. Increasingly, a quick and easy way has been to monitor the ratio between the Consumer Discretionary and Consumer Staples sectors.

Discretionary stocks primarily reflect companies that provide consumers with their wants, while Staples stocks are populated with firms supplying consumers' needs. The more investors have a risk-on mentality, the more likely the ratio between those two sectors will rise.

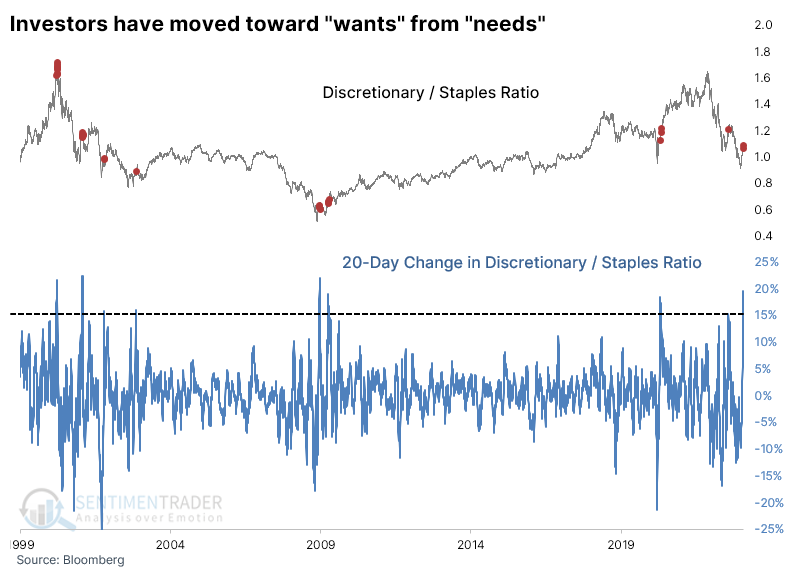
And rise it has. Over the past 20 sessions, the ratio of the total return between Discretionary and Staples soared nearly 20%, one of the largest changes in history. When the 20-day change in the ratio was at least modestly positive, investors tended to continue in that frame of mind for a while.

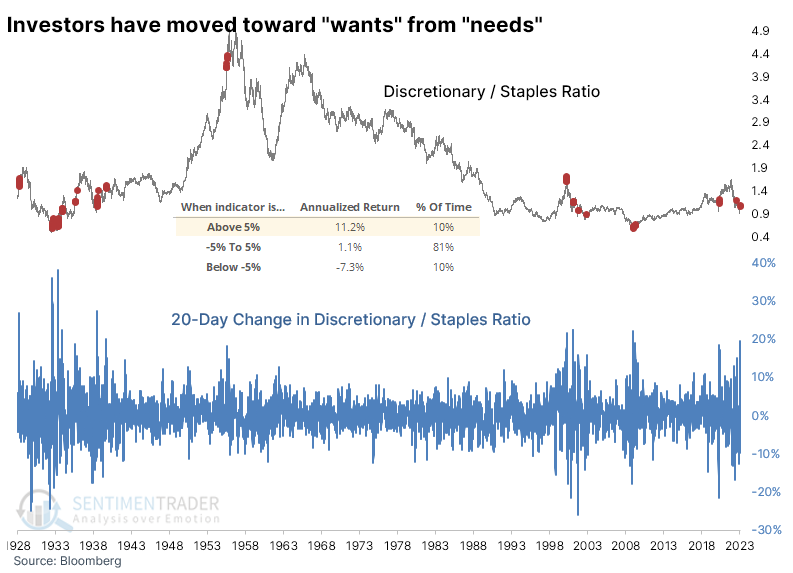
More recently, there were some false signals during the 2000-2002 bear market, but it also indicated the worst was over after the financial and pandemic crises.

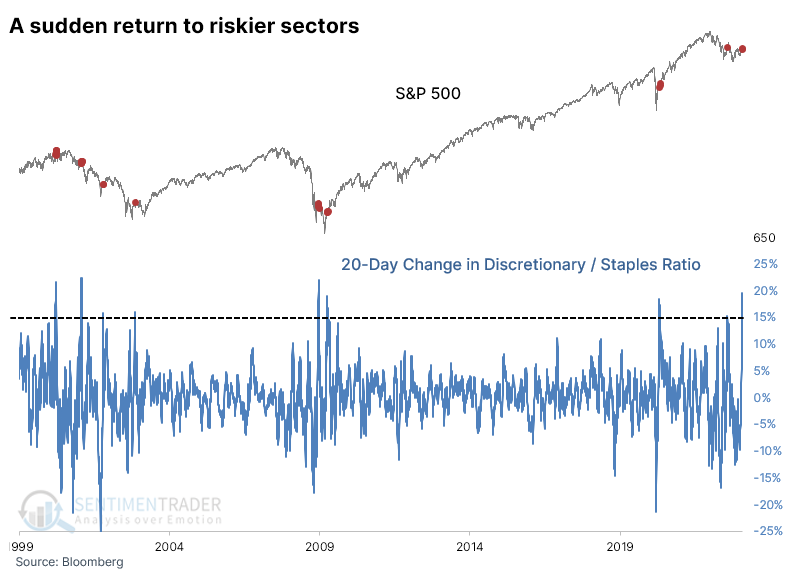
For the broader S&P 500 index, modestly positive changes in the ratio were good for the index. When the 20-day change in the ratio was above +5%, the S&P returned an annualized +15.7%, compared to only +2.2% when the change in the ratio was below -5%.

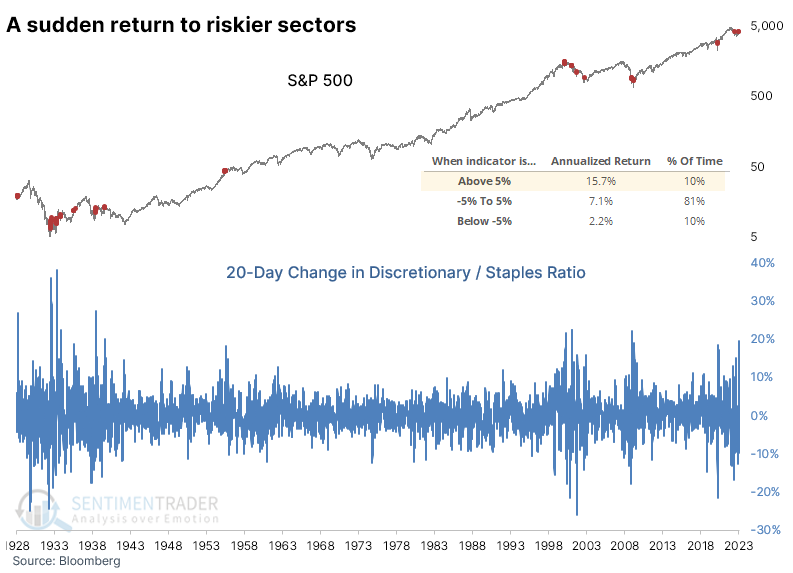
Of course, that index also suffered some false dawns during the bear market 20-odd years ago.

When the surge comes after a prolonged absence

One crucial piece of context is the behavior of investors before the surge in the ratio. When investors had pushed Discretionary stocks to at least a 2-year low relative to Staples, and then the ratio surged within the next few months, it tended to be a good sign for stocks. The sample size is tiny, of course, but over the next six months, the S&P 500 showed only one small loss that was erased immediately after.

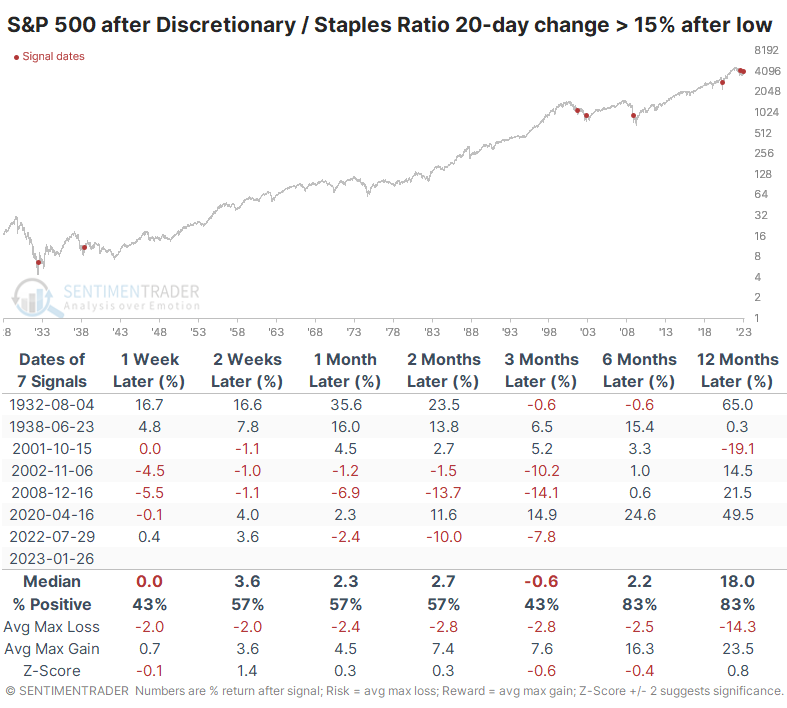
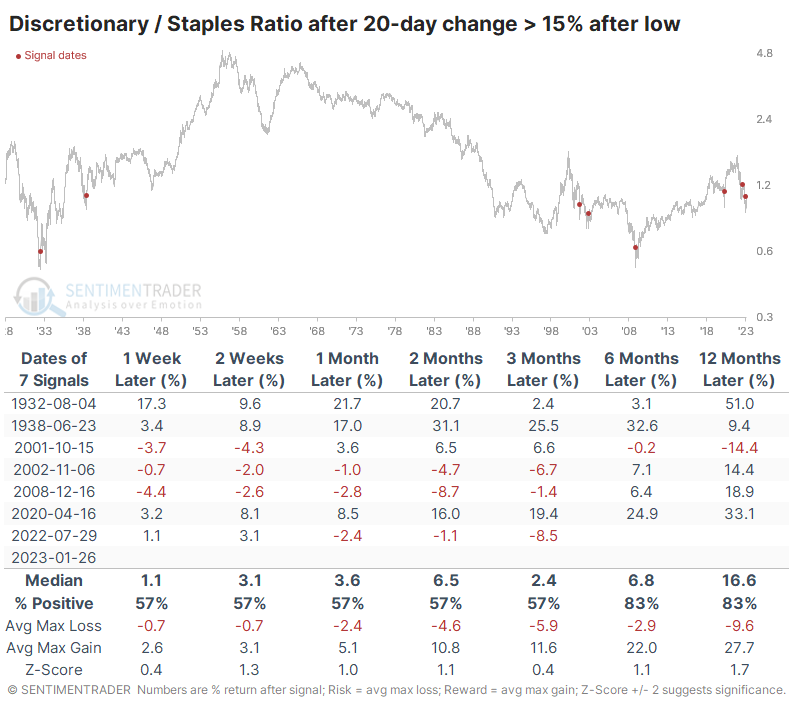
It was also a good sign for the ratio.

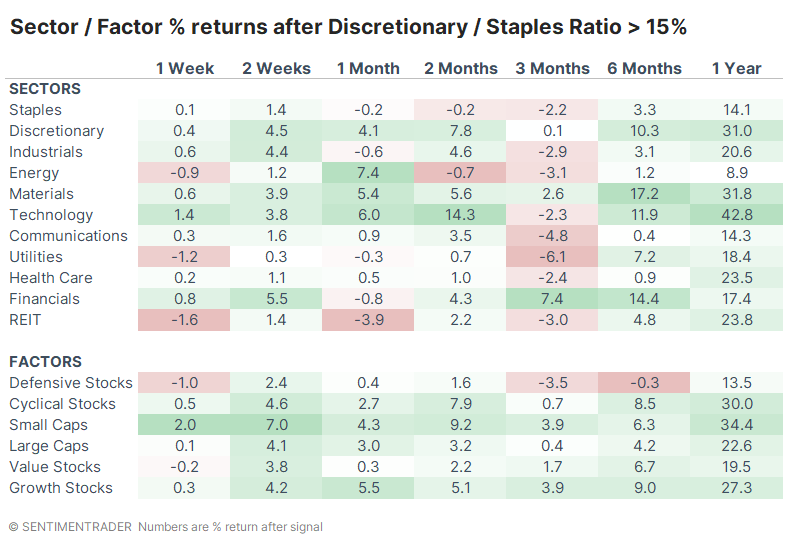
Among sectors and factors, Discretionary, Financials, and Technology tended to do best, as well as Small-Caps and Cyclicals.

What the research tells us...

Sustained bull markets need investors to be optimistic. There are signs that has occurred as stocks have rallied, which has been the way of markets forever. The move back into Discretionary stocks and away from Staples is another sign of an increasingly risk-on attitude, which can be dangerous during a prolonged bear market. The difference here is that the jump in risk-seeking behavior is coming off an extremely depressed level. While that can be a false signal (it has been a couple of times in the past), it tends to be more likely to be a sustained change in behavior and propel further long-term gains.

PRODUCTS
SentimenTrader
Trading Tools
Indicators & Data API
‍
Strategies & Scanner
‍
Research Reports
FREE
RESOUrCES
Simple Backtest
Calculator
Simple Seasonality
Calculator
The Kelly Criterion
Calculator
Sentiment Geo Map
‍
Public Research Reports
‍
Education
Sentiment Indicators
‍
Technical Indicators
‍
Pricing
Bundle pricing
‍
FAQ
‍
Announcements
‍
COMPANY
‍
About
‍
In the News
‍
Testimonials
‍
Client Success Stories
CONTACT
‍
General Inquiries
‍
Media Inquiries
‍
Financial Professionals Inquiries
‍
© 2026 Sundial Capital Research Inc. All rights reserved.
Setsail Marketing
TermsPrivacyAffiliate Program
Risk Disclosure: The information and tools provided are for research and analytical purposes only and are not intended as investment advice. Market analysis involves uncertainty, and outcomes may differ from expectations. Users should conduct their own due diligence and consider their individual circumstances before making any financial decisions. Past performance is not necessarily indicative of future results.

Hypothetical Performance Disclosure: Hypothetical performance results have many inherent limitations, some of which are described below. No representation is being made that any account will or is likely to achieve profits or losses similar to those shown; in fact, there are frequently sharp differences between hypothetical performance results and the actual results subsequently achieved by any particular trading program. One of the limitations of hypothetical performance results is that they are generally prepared with the benefit of hindsight. In addition, hypothetical trading does not involve financial risk, and no hypothetical trading record can completely account for the impact of financial risk of actual trading. for example, the ability to withstand losses or to adhere to a particular trading program in spite of trading losses are material points which can also adversely affect actual trading results. There are numerous other factors related to the markets in general or to the implementation of any specific trading program which cannot be fully accounted for in the preparation of hypothetical performance results and all which can adversely affect trading results.

Testimonial Disclosure: Testimonials appearing on this website may not be representative of other clients or customers and is not a guarantee of future performance or success.