
A sub-industry signal with a perfect record since 1942

Key points:
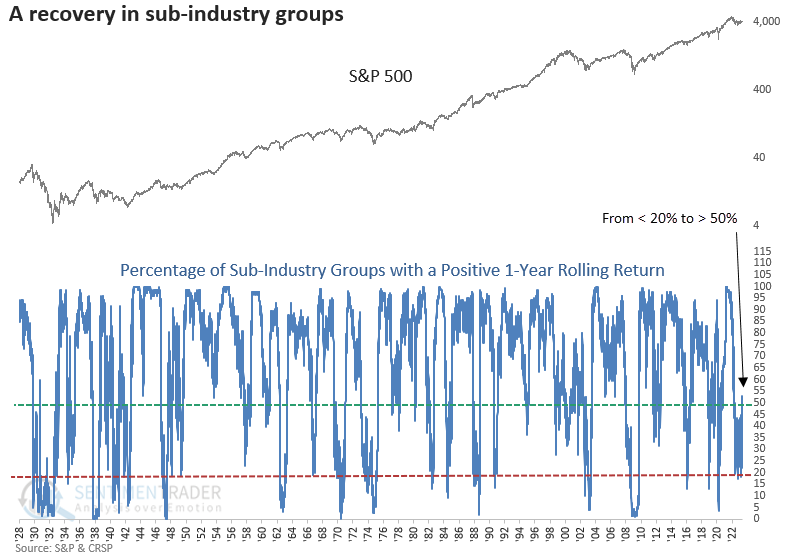
- The percentage of sub-industry groups with a positive 1-year rolling return cycled from < 20% to > 50%
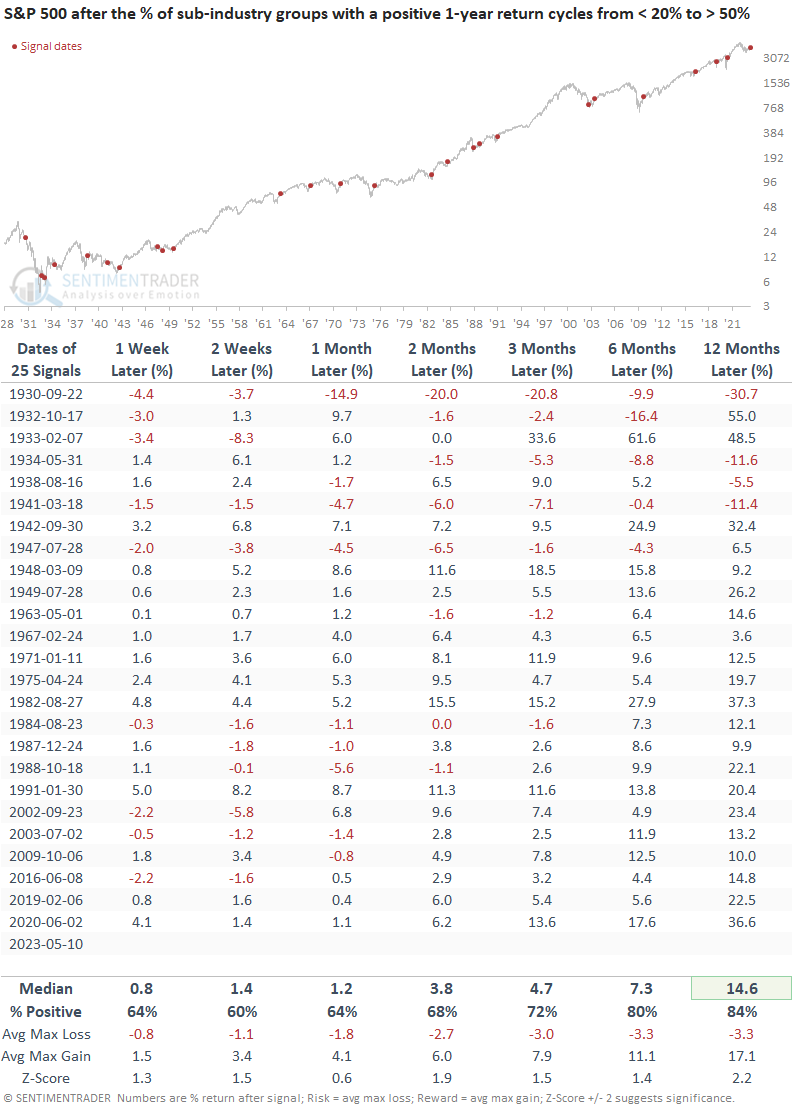
- After similar reversals, the S&P 500 was higher every time a year later in the post-WWII era
A majority of sub-industry groups now show a positive return over the last year
The recovery in long-term price-based indicators continues as time series like moving averages or rolling returns catch down and turn up, with most indexes moving sideways to slightly higher for almost a year.
The latest indicator to wave the all-clear signal is the percentage of sub-industry groups with a positive 1-year rolling return. For only the 26th time since 1930, the series cycled from < 20% to > 50%.
Similar reversals preceded excellent results
When the percentage of sub-industry groups with a positive 1-year rolling return cycle from < 20% to > 50%, the S&P 500 showed excellent results across all time horizons. Since 1942, the signal has had a perfect record a year later.
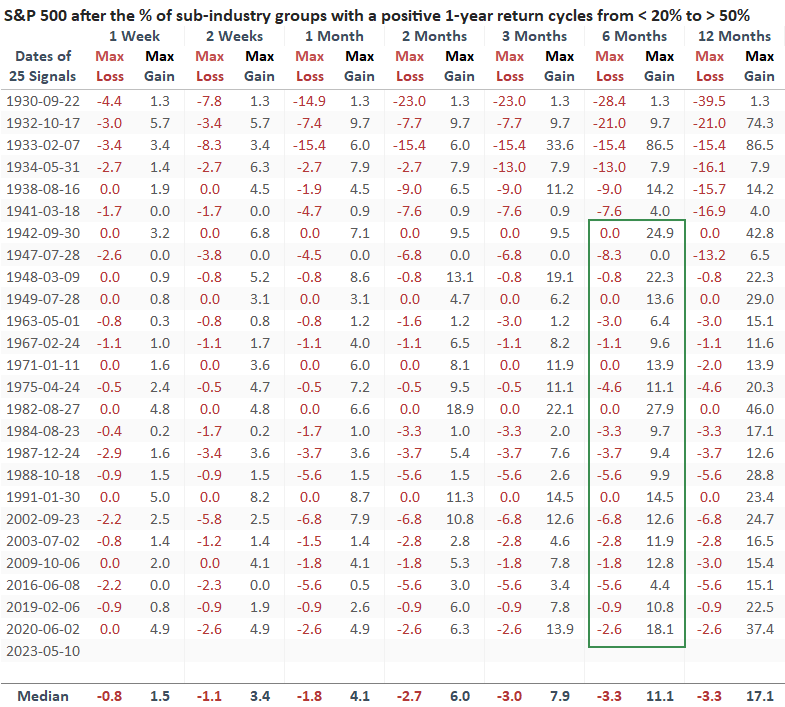
The max gain relative to the max loss has been outstanding since 1942. Out of 19 signals, only two resulted in a max loss exceeding the maximum gain over the six-month horizon. And the last -10% or greater max loss occurred in 1934.
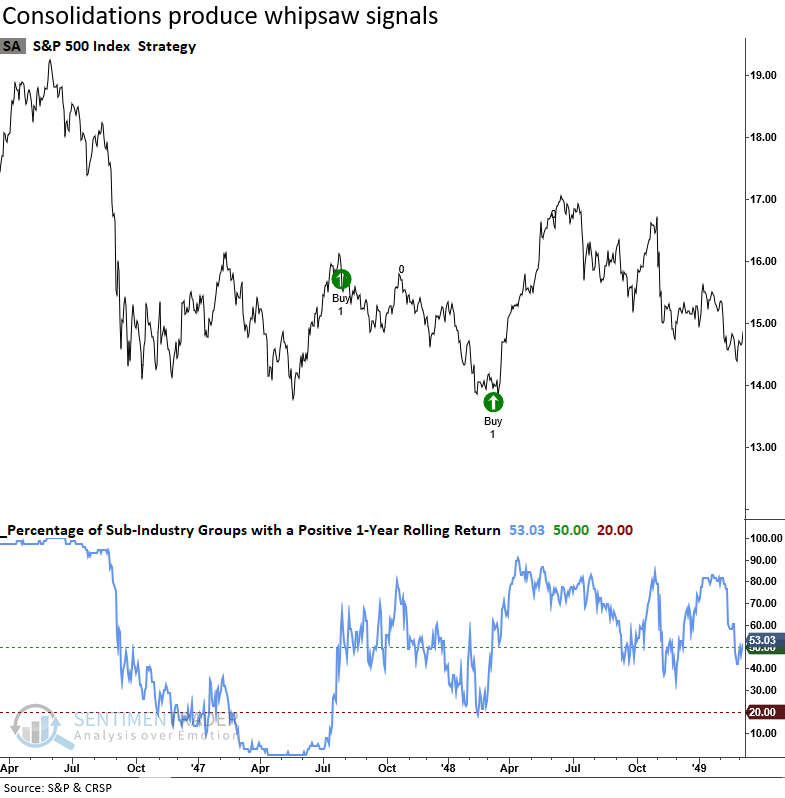
1946-49 analog
As has been the case with several long-term recovery signals highlighted over the last six months, the 1946-49 bear market continues to pop up in historical precedents.
What the research tells us...
With yet another long-term recovery signal triggering a bullish alert, the weight of the evidence continues to favor the bulls. When more than 50% of sub-industry groups exhibit positive momentum over the last year after falling to a historically low level, good things tend to happen to stocks. Since 1942, the S&P 500 has never been lower a year later. If a whipsaw signal were to occur, the 1946-49 analog would be the most likely outcome.