Data &
Technology
Research
Reports
Report Solutions
Reports Library
Actionable
Strategies
Free
Resources
Simple Backtest Calculator
Simple Seasonality Calculator
The Kelly Criterion Calculator
Sentiment Geo Map
Public Research Reports
Free Webinar
Pricing
Company
About
Meet Our Team
In the News
Testimonials
Client Success Stories
Contact
Log inLoginSign up
< BACK TO ALL REPORTS

A small-cap surge of historic proportions

Jason Goepfert
2020-10-08
The Russell 2000 index of small-capitalization companies has surged more than 10% over the past 2 weeks. This kind of buying interest has preceded further gains in the Russell every time and typically led to higher prices for the broader market, as well.

It's been one heck of a nice couple of weeks for small-cap stocks. As recently as a few weeks ago, there was a lot of talk about their relative weakness and how they tend to lag during Q4. Not so much anymore.

Over the past two weeks, the small-cap Russell 2000 has surged more than 11%, one of its largest 10-day gains since inception.

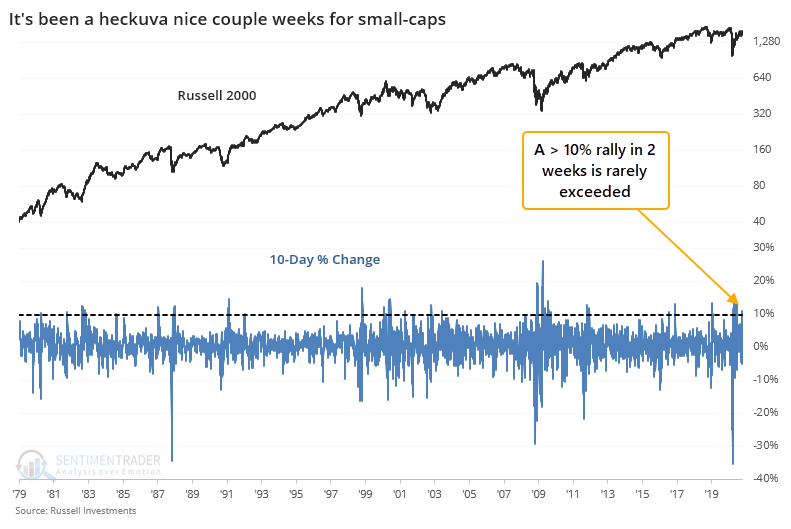
This kind of rebound typically happens after severe weakness, either on a relative or absolute basis. Either way, there have been only 20 distinct times over the past 40 years when the index shot higher by at least 10% over a 10-day stretch.

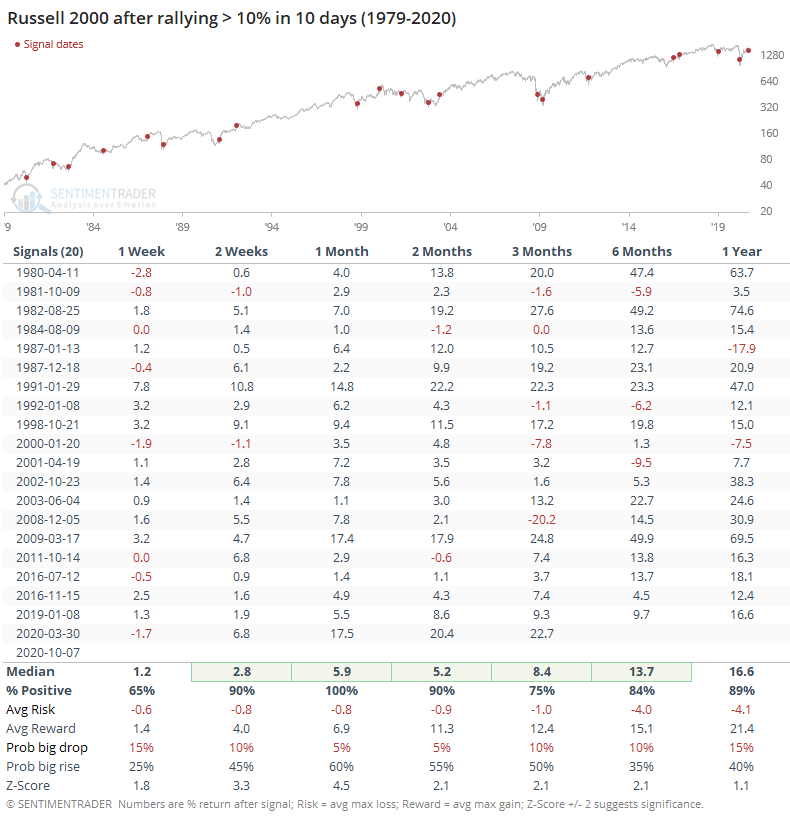
When buying interest was so intense, it tended to generate even more excitement. During the next month, the Russell never showed a loss, which is remarkable. In addition, there was a 60% probability of a big rise versus only a 5% probability of a big drop (see this Knowledge Base article for a more detailed explanation of terms).

Over the next 3 months, the risk/reward was heavily skewed toward the "reward" side, with a maximum gain that averaged more than 12% versus maximum risk that barely exceeded -1%.

It was a good sign for the broader market, as well, though not as good as for the Russell itself.

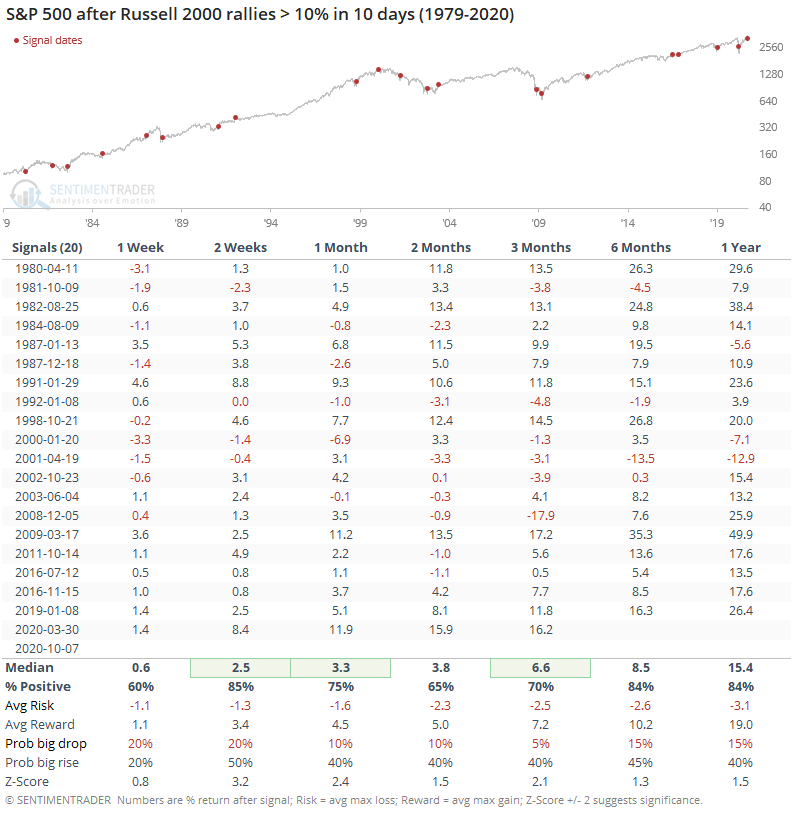
The consistency of gains, median return, and risk/reward for the S&P were quite good across all time frames, and the probability of an abnormally large rise was about 3x greater than the probability of an abnormally large loss. That didn't mean there were no losses, though - it would have hurt pretty good in 2001 and 2008.

There were only a handful of times this happened when the S&P was within 5% of a multi-year high.

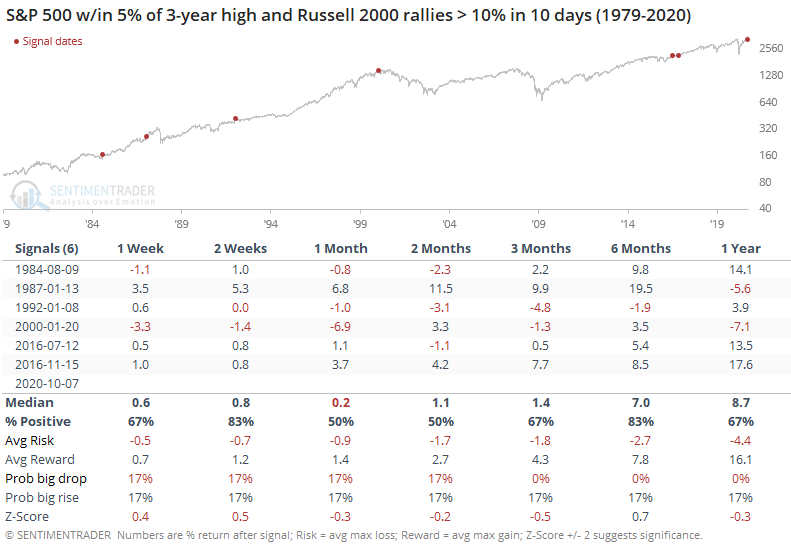
Again, this didn't prevent any losses at all, but they were at least contained. In 2000, it ultimately rolled over into a protracted bear market, but not before stocks rallied for months.

The strength in small-caps is why we're also seeing a surge in some of the breadth metrics. Those, too, have boded well for future returns. 

Sorry, you don't have access to this report

Upgrade your subscription plan to get access
Go to Dasboard
DATA &
TECHnologies
IndicatorEdge
‍
BackTestEdge
‍
Other Tools
‍
DataEdge API
RESEARCH
reports
Research Solution
‍
Reports Library
‍
actionable
Strategies
Trading Strategies
‍
Smart Stock Scanner
‍
FREE
RESOUrCES
Simple Backtest
Calculator
Simple Seasonality
Calculator
The Kelly Criterion
Calculator
Sentiment Geo Map
‍
Public Research Reports
‍
Free Webinar
COMPANY
‍
About
‍
Meet our Team
‍
In the News
‍
Testimonials
‍
Client Success Stories
Pricing
Bundle pricing
‍
Announcements
‍
FAQ
© 2024 Sundial Capital Research Inc. All rights reserved.
Setsail Marketing
TermsPrivacyAffiliate Program
Risk Disclosure: Futures and forex trading contains substantial risk and is not for every investor. An investor could potentially lose all or more than the initial investment. Risk capital is money that can be lost without jeopardizing ones’ financial security or life style. Only risk capital should be used for trading and only those with sufficient risk capital should consider trading. Past performance is not necessarily indicative of future results.

Hypothetical Performance Disclosure: Hypothetical performance results have many inherent limitations, some of which are described below. No representation is being made that any account will or is likely to achieve profits or losses similar to those shown; in fact, there are frequently sharp differences between hypothetical performance results and the actual results subsequently achieved by any particular trading program. One of the limitations of hypothetical performance results is that they are generally prepared with the benefit of hindsight. In addition, hypothetical trading does not involve financial risk, and no hypothetical trading record can completely account for the impact of financial risk of actual trading. for example, the ability to withstand losses or to adhere to a particular trading program in spite of trading losses are material points which can also adversely affect actual trading results. There are numerous other factors related to the markets in general or to the implementation of any specific trading program which cannot be fully accounted for in the preparation of hypothetical performance results and all which can adversely affect trading results.

Testimonial Disclosure: Testimonials appearing on this website may not be representative of other clients or customers and is not a guarantee of future performance or success.