Data &
Technology
Research
Reports
Report Solutions
Reports Library
Actionable
Strategies
Free
Resources
Simple Backtest Calculator
Simple Seasonality Calculator
The Kelly Criterion Calculator
Sentiment Geo Map
Public Research Reports
Free Webinar
Pricing
Company
About
Meet Our Team
In the News
Testimonials
Client Success Stories
Contact
Log inLoginSign up
< BACK TO ALL REPORTS

A simple trading strategy for QQQ using Social Sentiment

Eric D. Brown
2017-01-09
null

Over the weekend, I was asked to take a look at strategies for the QQQ ETF using our QQQ social sentiment indicator.

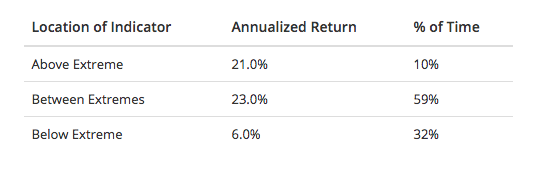
Before I start doing any development on a strategy, I like to first look at the threshold returns of the indicator at question to determine if there's enough returns to work with in the strategy. The QQQ Social Sentiment threshold returns (shown in Table 1) show some decent for extremes, so its definitely worth diving into a few simple strategies with his indicator to see what we can see.

[caption id="attachment_1105" align="aligncenter" width="544"]QQQ Social Sentiment Threshold Returns Table 1: QQQ Social Sentiment Threshold Returns[/caption]

When looking at strategies for indicators, I like to start simple so I built the simplest strategy that I could.  For this strategy, the rules are:

  • a buy signal is given when the QQQ Social Sentiment indicator closes above a Pessimistic Extreme (2.5). A buy order is placed at the open the day after a signal is generated.
  • a sell signal is given when the QQQ Social Sentiment indicator closes below an Optimistic Extreme (0.9). A sell order is placed at the open the day after a signal is generated.
  • Commission is a percentage based on the size of the traded shares
  • Rather than use a set number of shares, this strategy uses all of the available cash to purchase shares.
  • Starting account size is $100K
  • Trading dates are: Nov 3 2011 to Jan 6 2017 (all available dates for our social sentiment indicator).

The trading strategy delivers some good results with an 8.48% annual return (without any leverage), 0.68% average per trade return, 1.49% average winning trade return  and a 67% win rate. Additionally, drawdowns are fairly well managed with the largest drawdown being 11.66% lasting 53 days.

Trade statistics and performance for this trading strategy is provided below.

[caption id="attachment_1104" align="aligncenter" width="374"]QQQ Social Sentiment Summary Stats 
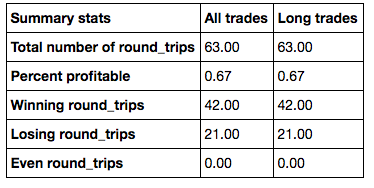
Table 2: QQQ Social Sentiment Summary Stats[/caption]

[caption id="attachment_1103" align="aligncenter" width="464"]QQQ Social Sentiment Trade Stats 
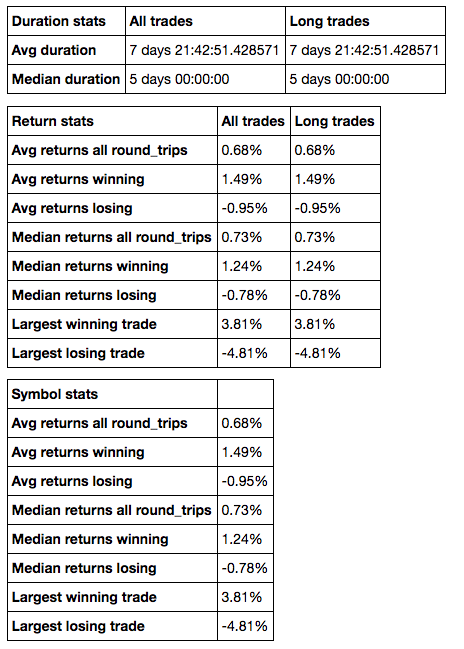
Table 3: QQQ Social Sentiment Trade Stats[/caption]

Additional trade statistics and performance graphs are displayed below.

[caption id="attachment_1109" align="aligncenter" width="700"]QQQ Trade Stats 
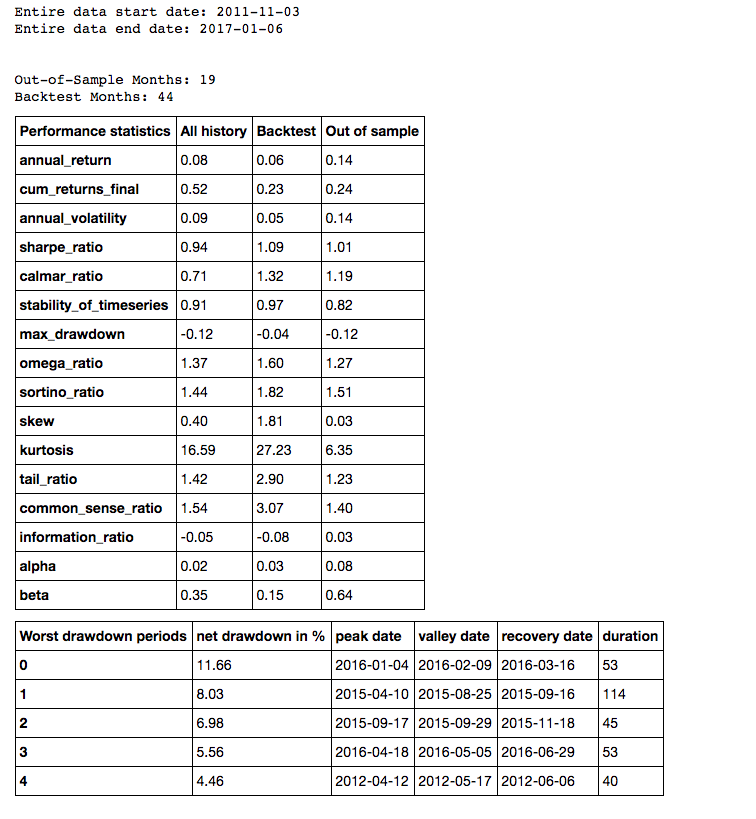
Table 4: QQQ Trade Statistics[/caption]

[caption id="attachment_1106" align="aligncenter" width="700"]QQQ Social Sentiment Performance Graphs 
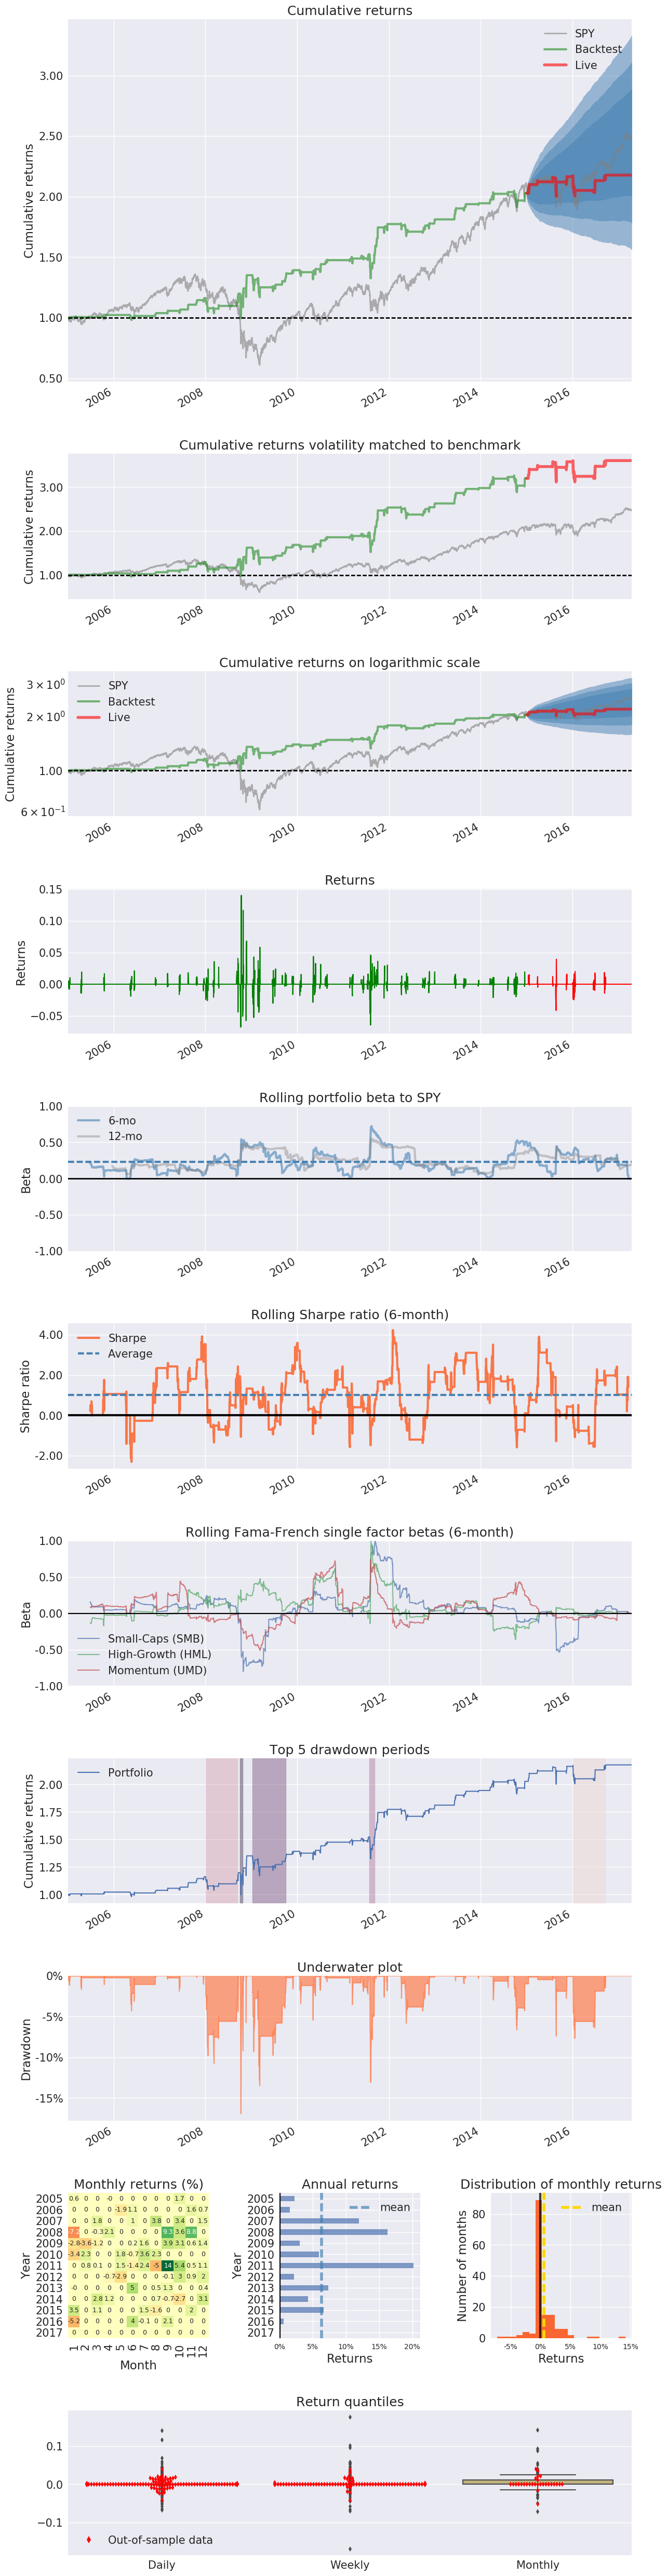
Figure 1: QQQ Social Sentiment Performance Graphs[/caption]


Sorry, you don't have access to this report

Upgrade your subscription plan to get access
Go to Dasboard
DATA &
TECHnologies
IndicatorEdge
‍
BackTestEdge
‍
Other Tools
‍
DataEdge API
RESEARCH
reports
Research Solution
‍
Reports Library
‍
actionable
Strategies
Trading Strategies
‍
Smart Stock Scanner
‍
FREE
RESOUrCES
Simple Backtest
Calculator
Simple Seasonality
Calculator
The Kelly Criterion
Calculator
Sentiment Geo Map
‍
Public Research Reports
‍
Free Webinar
COMPANY
‍
About
‍
Meet our Team
‍
In the News
‍
Testimonials
‍
Client Success Stories
Pricing
Bundle pricing
‍
Announcements
‍
FAQ
© 2024 Sundial Capital Research Inc. All rights reserved.
Setsail Marketing
TermsPrivacyAffiliate Program
Risk Disclosure: Futures and forex trading contains substantial risk and is not for every investor. An investor could potentially lose all or more than the initial investment. Risk capital is money that can be lost without jeopardizing ones’ financial security or life style. Only risk capital should be used for trading and only those with sufficient risk capital should consider trading. Past performance is not necessarily indicative of future results.

Hypothetical Performance Disclosure: Hypothetical performance results have many inherent limitations, some of which are described below. No representation is being made that any account will or is likely to achieve profits or losses similar to those shown; in fact, there are frequently sharp differences between hypothetical performance results and the actual results subsequently achieved by any particular trading program. One of the limitations of hypothetical performance results is that they are generally prepared with the benefit of hindsight. In addition, hypothetical trading does not involve financial risk, and no hypothetical trading record can completely account for the impact of financial risk of actual trading. for example, the ability to withstand losses or to adhere to a particular trading program in spite of trading losses are material points which can also adversely affect actual trading results. There are numerous other factors related to the markets in general or to the implementation of any specific trading program which cannot be fully accounted for in the preparation of hypothetical performance results and all which can adversely affect trading results.

Testimonial Disclosure: Testimonials appearing on this website may not be representative of other clients or customers and is not a guarantee of future performance or success.