
A simple and consistent commodity trend that few know of

Key points:
- Palladium is an industrial metal that most traders have heard of, but few pay attention to
- The price for this widely used commodity tends to move in a highly cyclical fashion, with only two major turning points per year
- Palladium can be traded in the futures market or via an ETF
Palladium and its seasonal trends
Under the category of "opportunity is where you find it," in this piece, we will go off the beaten path to highlight a widely used but little-known commodity whose price movements are highly cyclical.
Physical palladium is used in many different ways and is a vital commodity. Despite that, trading in this market on the commodities futures exchange is relatively thin compared to many other commodities. It can be highly volatile, and significant fluctuations are not uncommon, making it unsuitable for most smaller traders.
There is an ETF alternative for traders unwilling or unable to weather the sheer size of futures contract fluctuations; here, too, trading is light. Nevertheless, it may be a good candidate for traders seeking opportunities where few others are looking.
The chart below displays the annual seasonal trend for palladium futures.
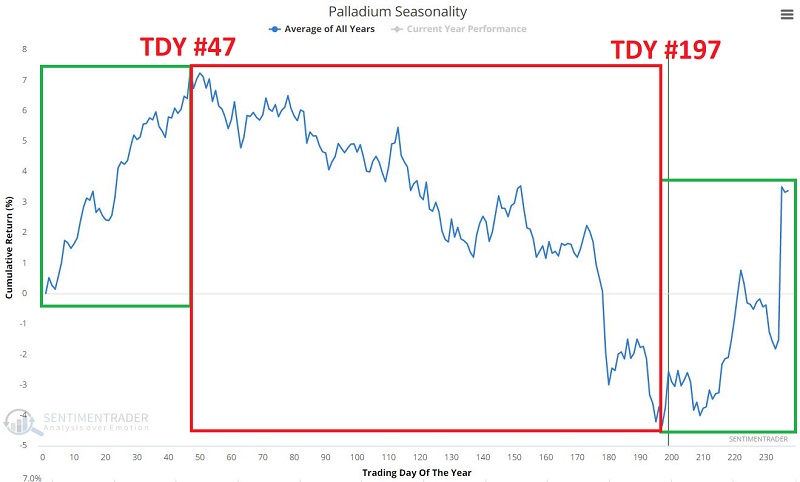
It is possible to break the seasonal calendar year into two periods based on the Trading Day of the Year (TDY):
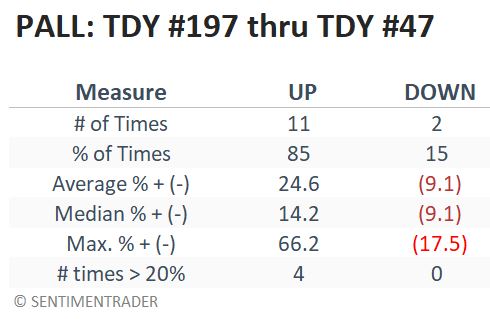
- The favorable period runs from Trading TDY #197 through TDY #47
- The unfavorable period runs from TDY #47 through TDY #197
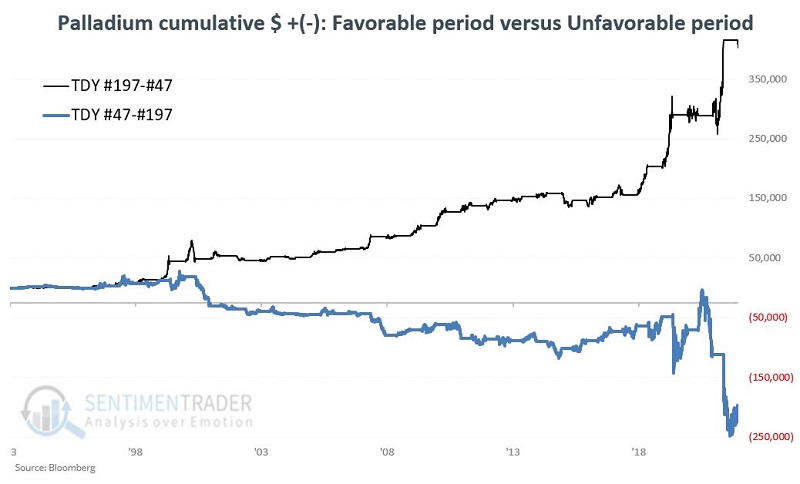
Can it be that simple? The chart below displays the hypothetical dollar return from holding a long position in palladium, depending on the time of year.
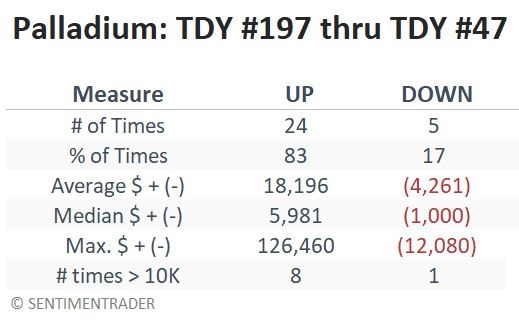
During the favorable periods, palladium rose 83% of the time. During those up years, palladium's returns far exceeded the relatively minor losses during the down years.
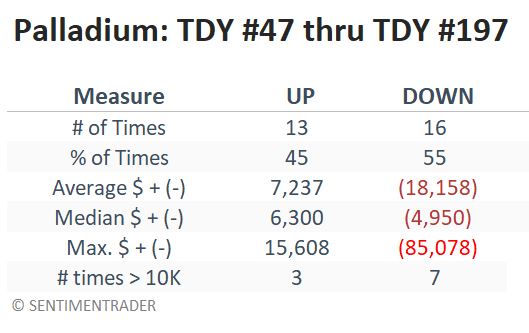
During the unfavorable periods, palladium rose only 45% of the time. And when it declined, it tended to suffer much larger losses than it gained during the up years.
An ETF alternative
The abrdn Physical Palladium Shares ETF (PALL) holds physical palladium. The good news is that PALL offers a way to trade palladium without trading futures contracts. The bad news is that trading is relatively thin, with roughly only 20,000 shares changing hands daily. Luckily, the seasonal approach suggested above only requires two trades per year.
The chart below displays the hypothetical percentage return from holding a long position in PALL, depending on the time of year.

The table below displays a summary of results during the favorable periods.
The table below displays a summary of results during the unfavorable periods.
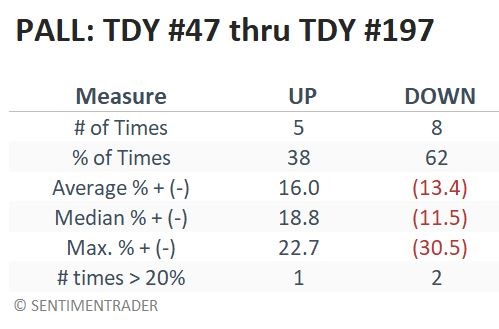
From TDY #197 in 2021 to TDY #47 in 2022, PALL registered its largest gain for this period, +66%. From TDY #47 in 2021 through TDY #197 in 2022, PALL plunged -27%.
The newest favorable period began at the close on October 4, and in the three trading days since PALL has quickly plunged -5.5%. This movement highlights the volatile nature of palladium prices but may also be a more attractive entry point for a trader looking to play the long side of Palladium. This current favorable period will last into early March of 2023.
What the research tells us…
Palladium is not a market that most traders ever consider. This is evident given the relatively thin trading in both the futures market and the ETF. Nevertheless, that does not mean there is no potential for decent returns. Traders who focus on playing the long side of this market from roughly early October into early March of the following year and/or on playing the short side during the rest of the year may have the odds on their side.