
A simple 3-pronged system for bitcoin

Key points:
- We define a simple system for bitcoin that includes price, sentiment, and breadth
- This Triple 40 system, when healthy, has shown outsized gains with modest drawdowns
- With recent weakness, the system has flipped to an unhealthy level
Price, sentiment, and breadth
As cryptocurrencies become a more viable investment vehicle, demand is growing for exposure to the asset class but some protection from its notorious swings.
To keep things as simple as possible, we'll focus on one measure each of price action, sentiment, and breadth within the crypto space.
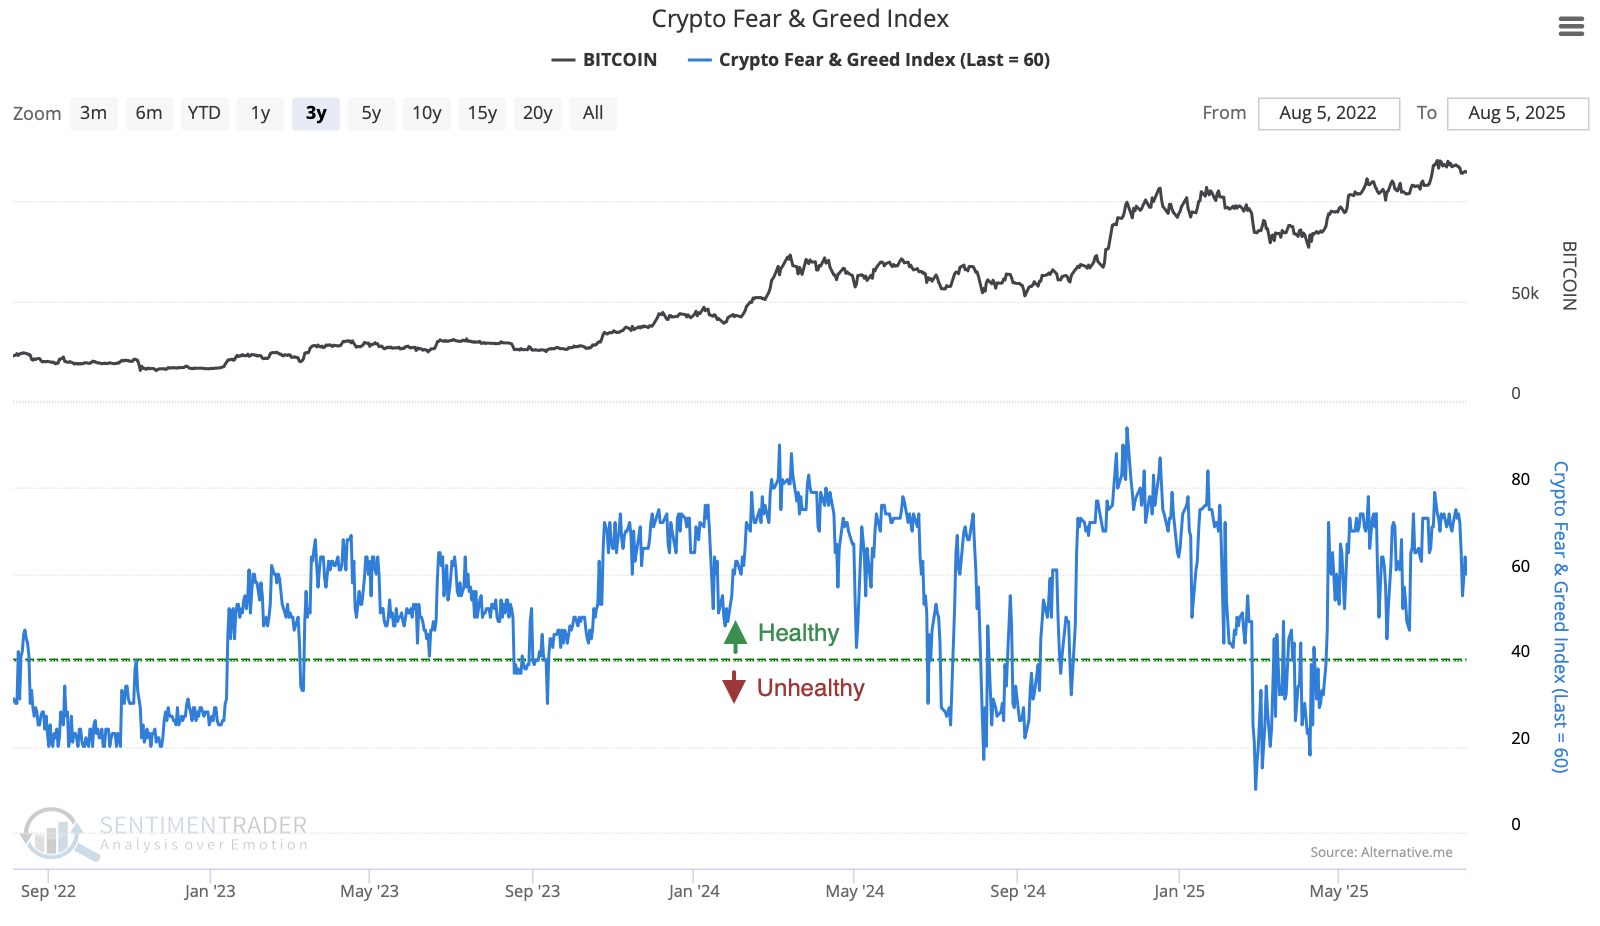
During healthy trends, we tend to see at least 40% of traders bullish on bitcoin. We can approximate this using the Crypto Fear & Greed model.
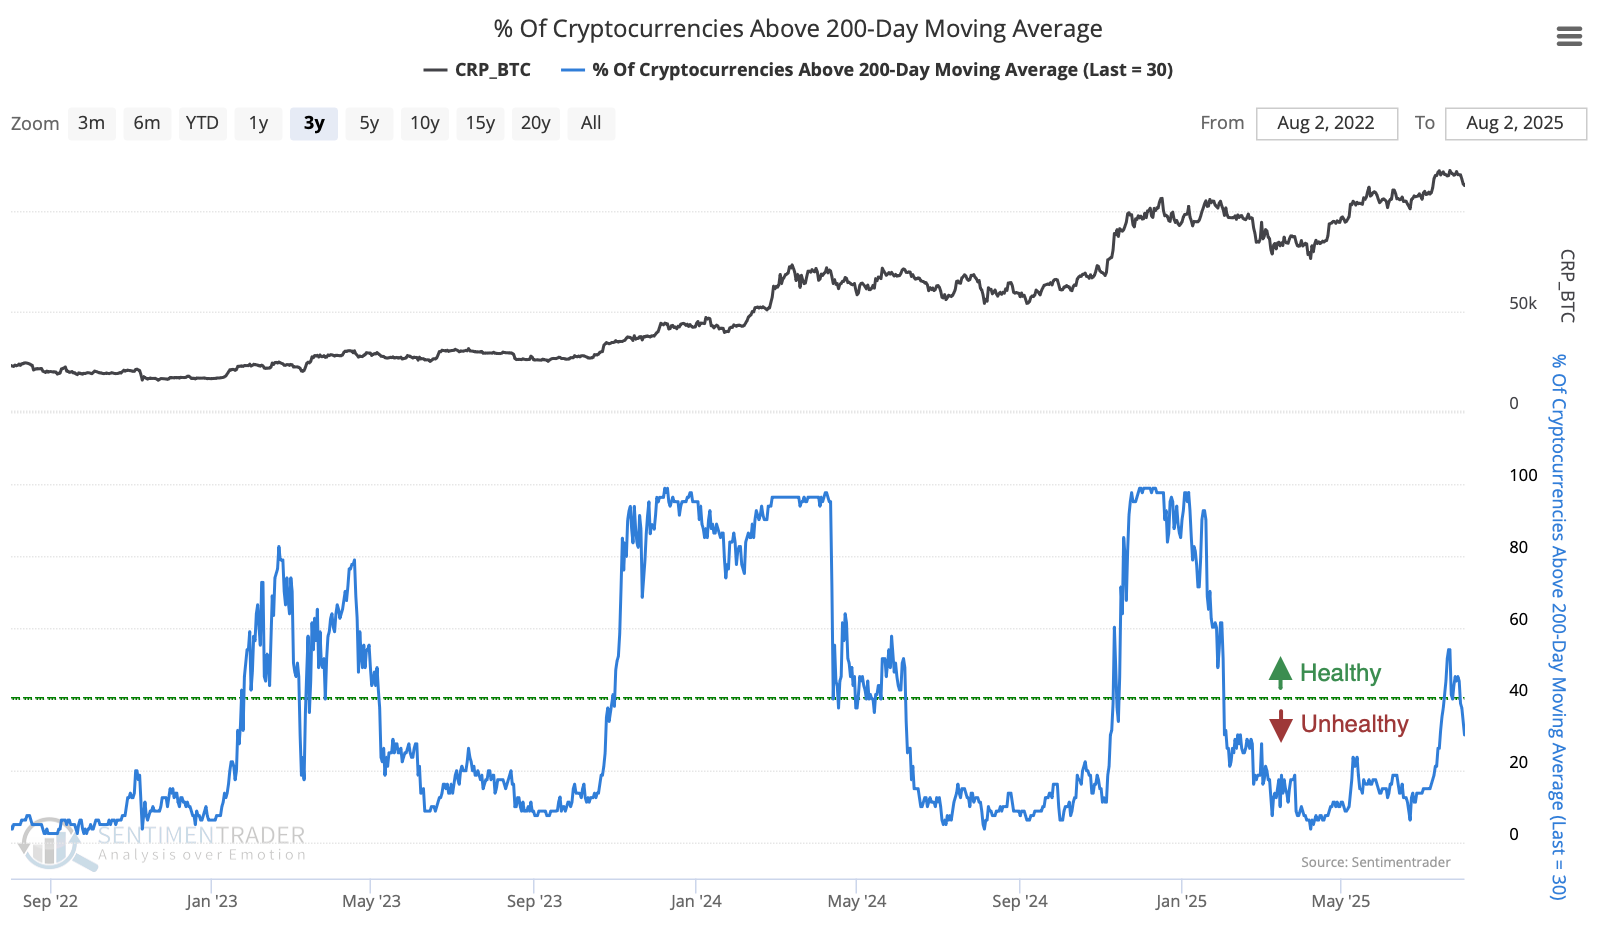
The most persistent trends also show that at least 40% of cryptocurrencies are trading above their 200-day moving averages.
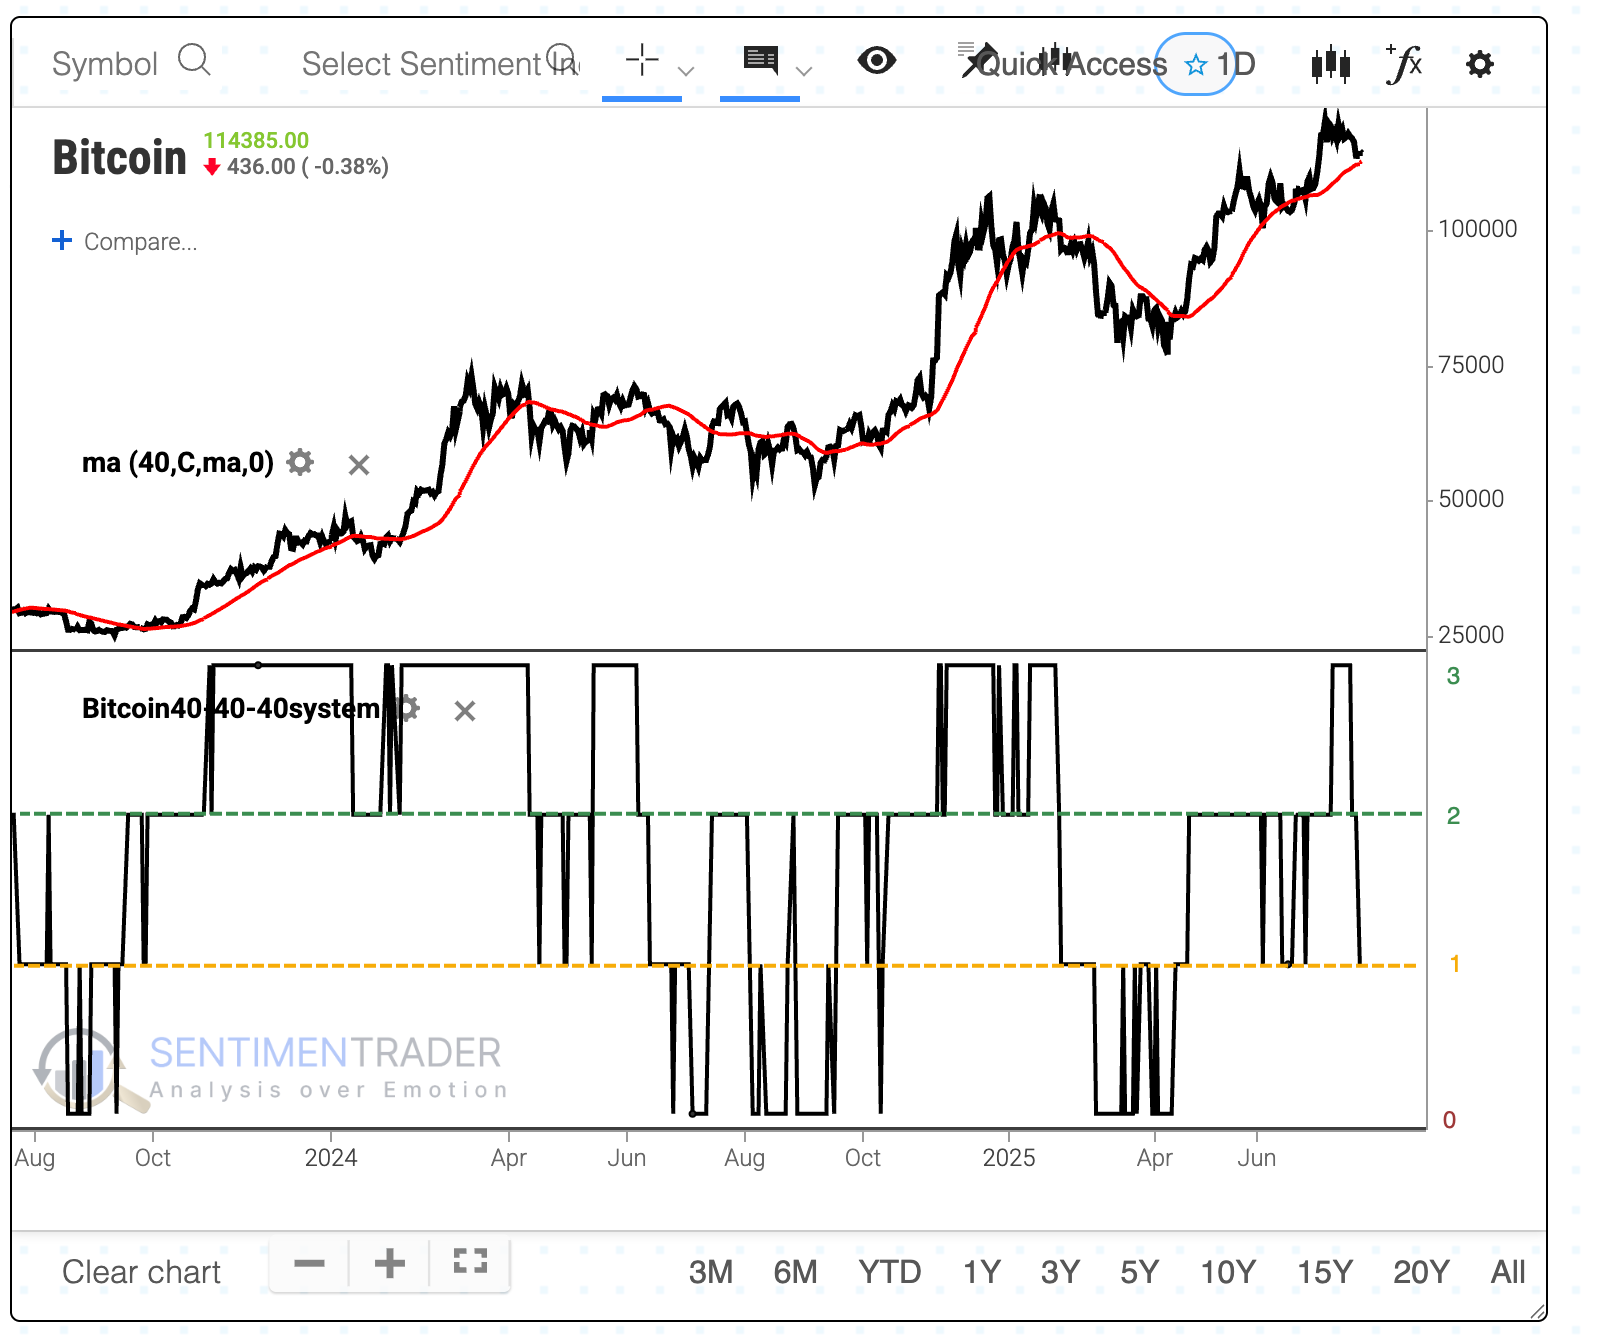
Most of the sustained trends in bitcoin saw the currency stay above its 40-day moving average. While not perfect - or optimized - it's been a decent guide to staying in some of the best trends without getting shaken out too often, or sticking around too long.
We can combine the three factors into a Triple 40 system:
- Bitcoin is above its 40-day moving average
- At least 40% of traders are bullish
- At least 40% of cryptocurrencies are above their 200-day averages
This is shown in the chart below, with the system receiving 1 point for meeting each of the conditions.
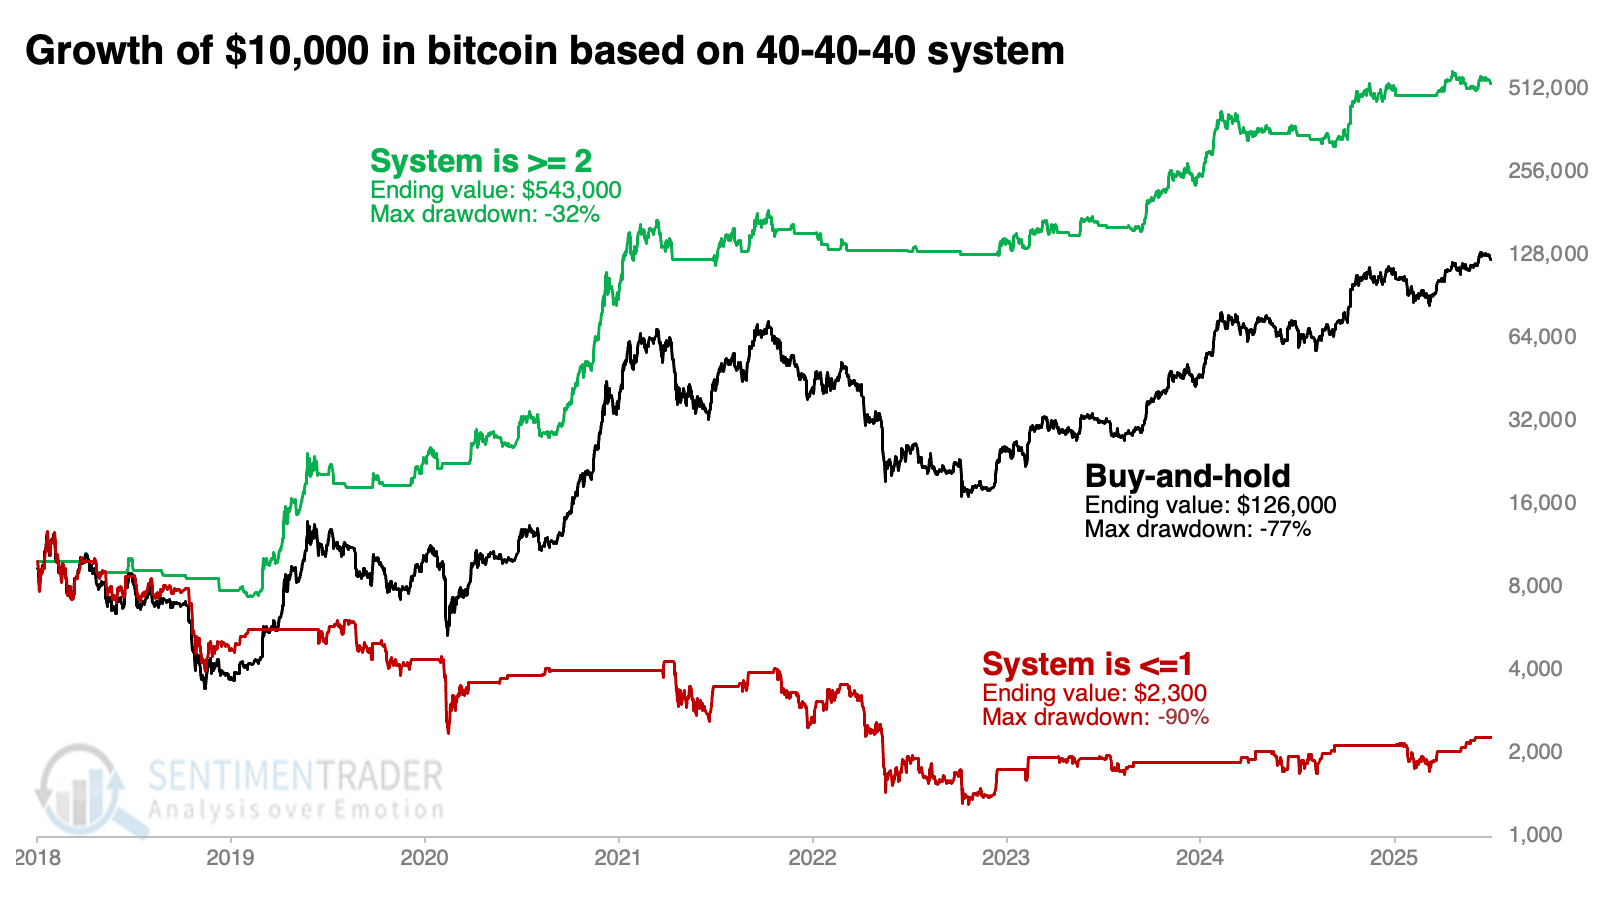
Non-equitable equity curves
To judge the efficacy of using these factors as an environmental guide to bitcoin, the equity curve line below shows how $10,000 grew if the system was 1 or below (red line) and 2 or above (green line). The black line shows the return for simply buying and holding.
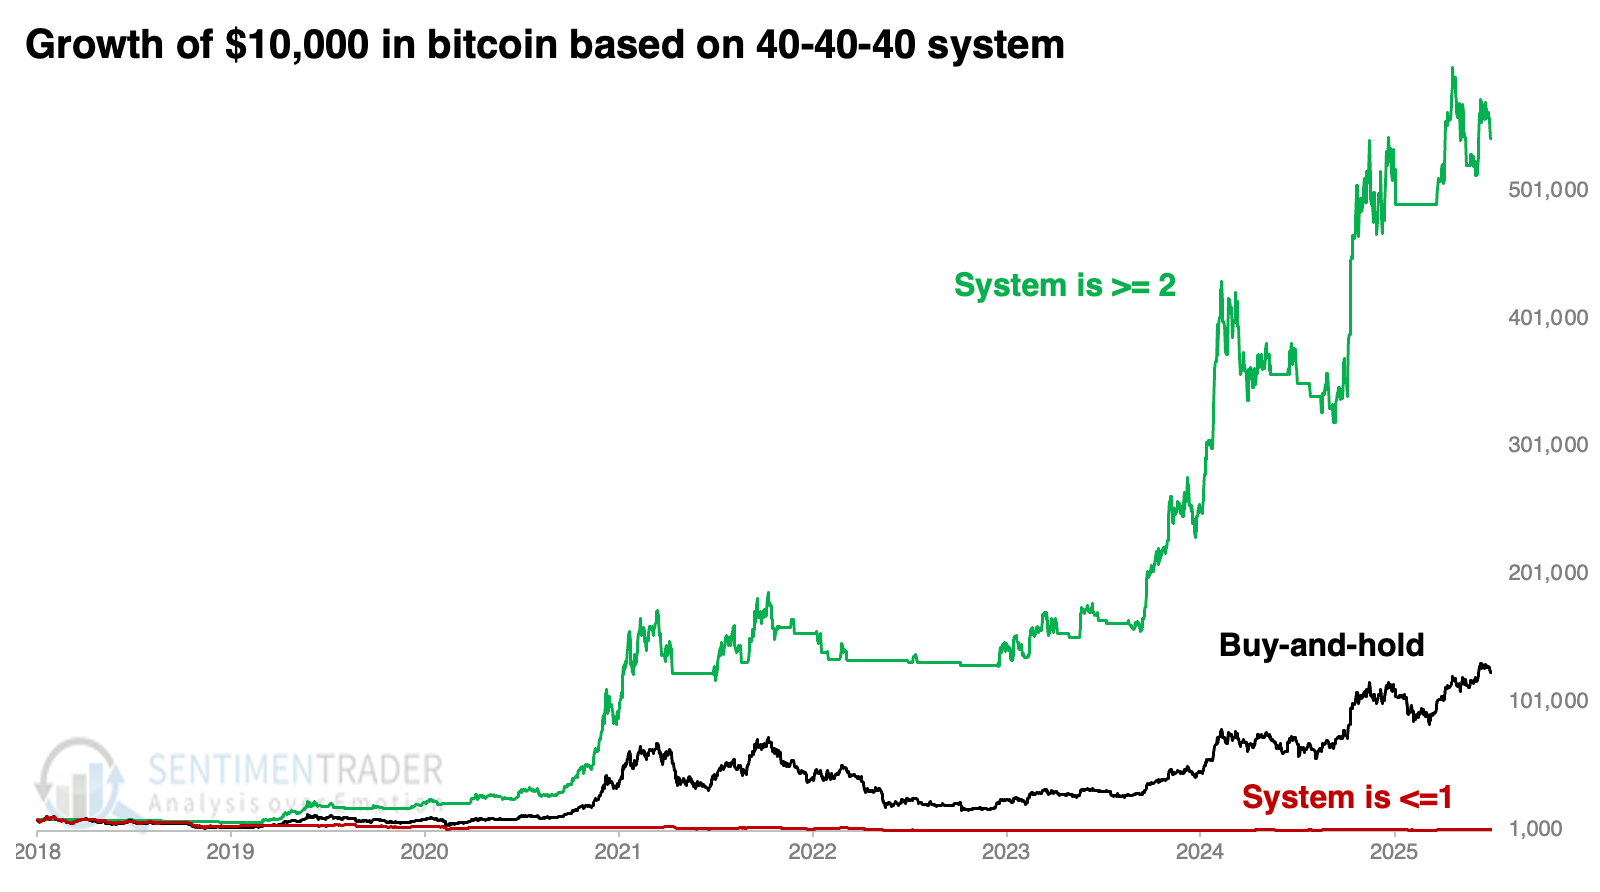
With an asset with such impressive returns, it's better to show the chart on a logarithmic scale. We can see below that using these parameters, $10,000 would have turned into $543,000 when at least two factors were bullish. That's more than 4x a buy-and-hold return, while suffering less than half the drawdown.
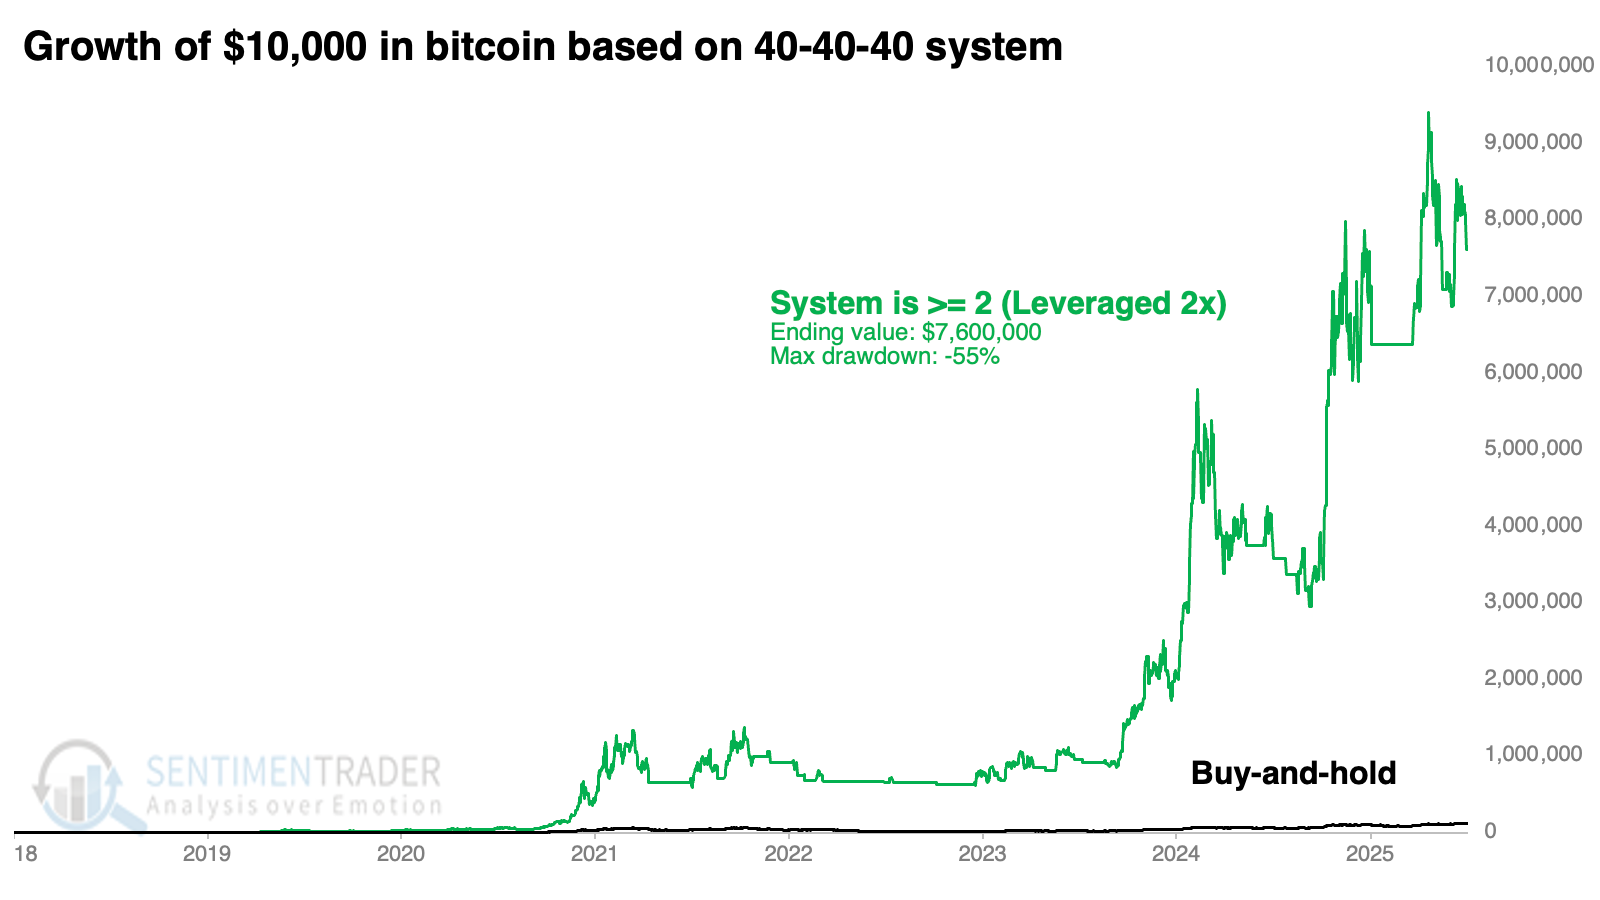
We tend to err on the conservative side and would never recommend this as an actual strategy, but if a high-risk trader wished to goose their returns, then using 2x leverage when the system was 2 or better would have netted $7.6 million and still with a smaller drawdown than buy-and-hold.
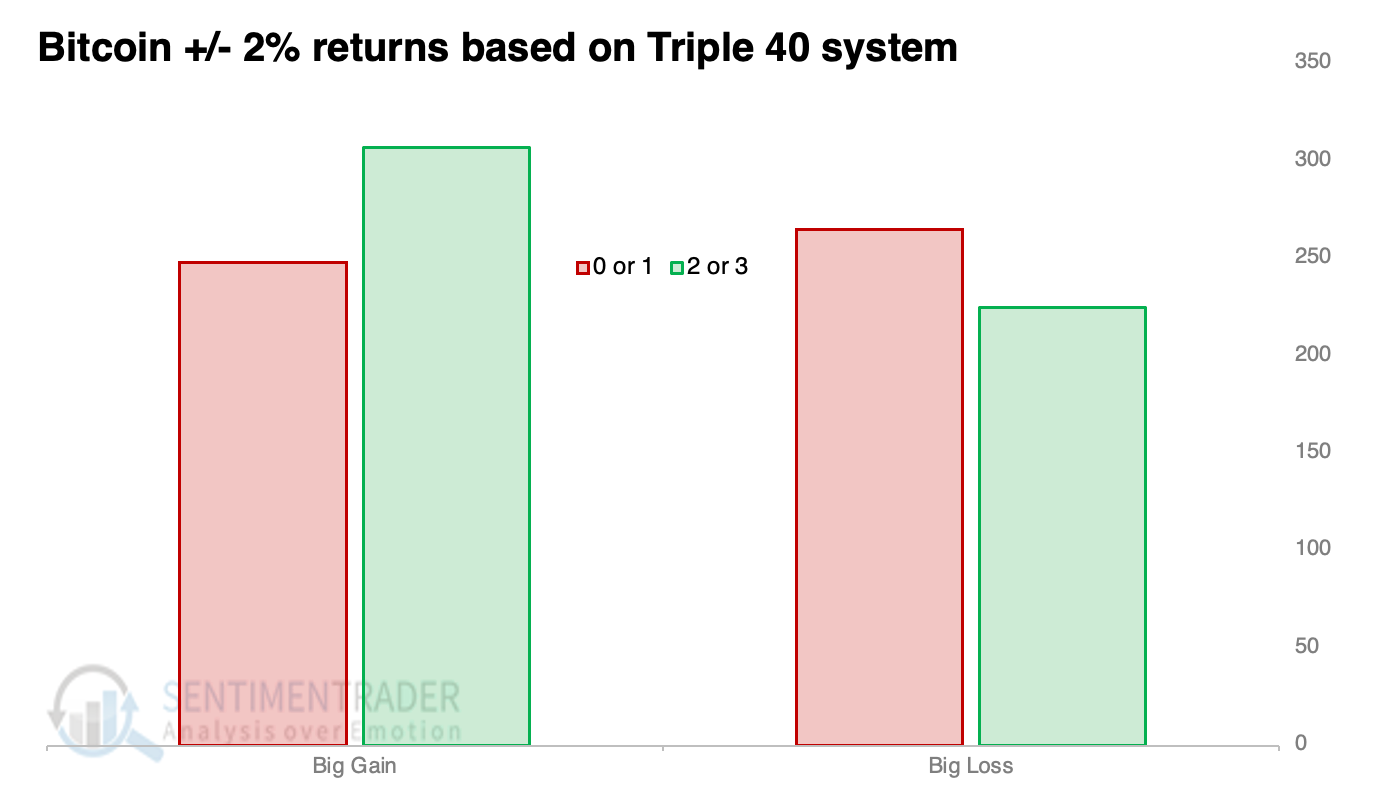
As a volatile asset, bitcoin has a habit of experiencing its largest moves at the extremes. When oversold, it suffers large declines and snap-back rallies; when overbought, momentum can carry it to tremendous one-day gains and outsized losses.
The chart below shows that moves of +2% occur more frequently when the Triple 40 system is at a 2 or above. Losses of 2% or more occur more frequently when the system is at 1 or below. We'd like to see the skew even more, well, skewed, but this shows that a trader has a better shot of a big gain than a big loss when the system is positive.
You can click here to load these criteria using the Backtest Engine and/or go to the Analysts' Backtests page and click the plus sign to add it to your signals.
We've discussed other simple technical and fundamental systems for bitcoin, keeping in the tradition of mostly traditional measures readily available to the public, without undue risk-taking or hyperactive behavior.
- Using PMI and M2 as fundamental overlays (one is currently bullish, the other neutral)
- RSI regime (which just flipped back to neutral)
- Trend and relative trend scores (currently bullish)
What the research tells us...
There has been a recent deterioration in the percentage of cryptocurrencies trading above their 200-day moving averages, and Tuesday's decline pushed bitcoin below its 40-day moving average. So, the Triple 40 system only has one of its components in positive territory, which has been a riskier environment for the currency. Generally, it pays to keep an eye on these basic measures to gauge the market's health, especially for shorter-term traders.