
A silly indicator with a deadly record just triggered

Bulls' favorite punching bag is swinging again
Everyone's favorite technical punching bag is back. Non-technical market people love to make fun of warnings like the Hindenburg Omen. The hyperbolic name, combined with the occasional failure, makes it a go-to source of comedy for those opposed to technical analysis, market history, and data mining.
The trouble with those people is they suffer from recency bias and a whole host of other cognitive delusions. There is no doubt that the Hindenburg Omen and its cousin the Titanic Syndrome were born out of a data-mining fever dream. Even so, they've been functioning in real-time for decades and have proven their use.
Even during the past decade of one of the strongest, most durable, most persistent bull markets of all time, a single Hindenburg Omen warning preceded fragile returns over the medium-term in the S&P 500, according to our Backtest Engine. The Engine is an excellent tool to separate fact from fiction in mere seconds.
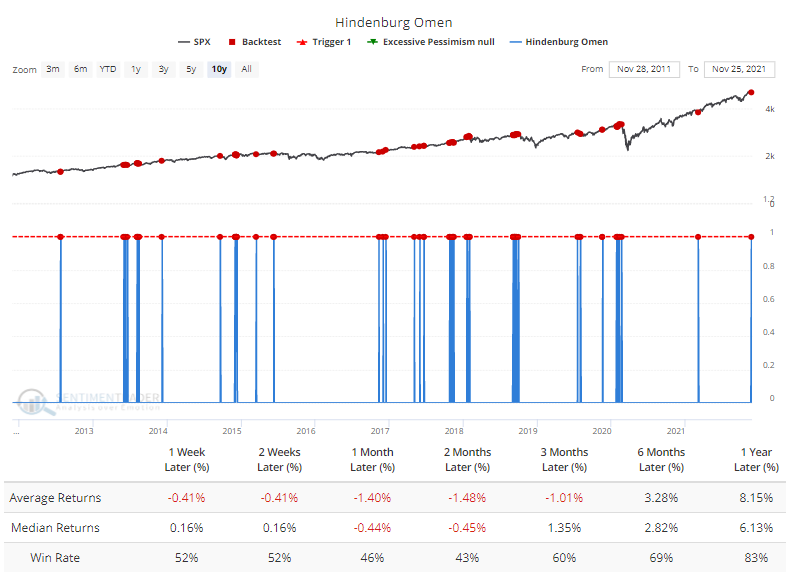
Single warning signs, like we saw in March, are less of a worry. It's a more significant issue when we see multiple days of warnings and on more than a single exchange.
This is a problem now because they've been firing consistently lately, ahead of Friday's carnage. In just a few days, a combined 12 warning signs have triggered between the NYSE Hindenburg Omen, Nasdaq Hindenburg Omen, NYSE Titanic Syndrome, and Nasdaq Titanic Syndrome.
It's been rare to see such a big cluster of warnings across both exchanges over the past 25 years.

| Stat box Only 10% of members of India's Nifty 50 index are trading above their 50-day moving averages. Over the past decade, the Nifty has rebounded over the next 3 months after 53 out of 58 days with such a low reading. |
A negative breadth divergence
A new signal from a voting member in the composite risk-off model registered an alert on Friday. The component is called the Breadth Composite Divergence model.
The composite peaked in May and has made a series of lower highs and lower lows. Conversely, the S&P 500 has made a series of higher highs and higher lows. This pattern is known as a bearish divergence setup.
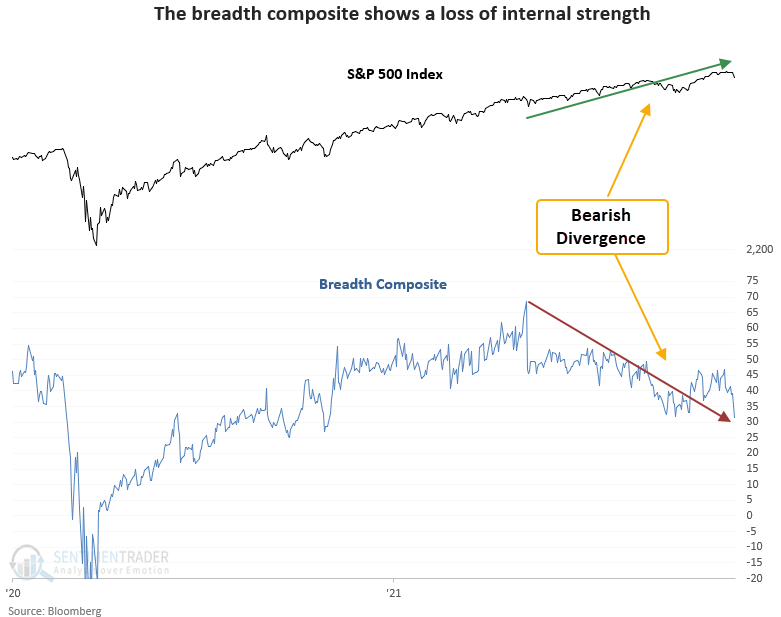
The signal has triggered 24 other times over the past 93 years. After the others, future returns and win rates were weak in the short term with several unfavorable risk/reward profiles.
