
A significant uptick in the spread between 52-week highs and lows

Key points:
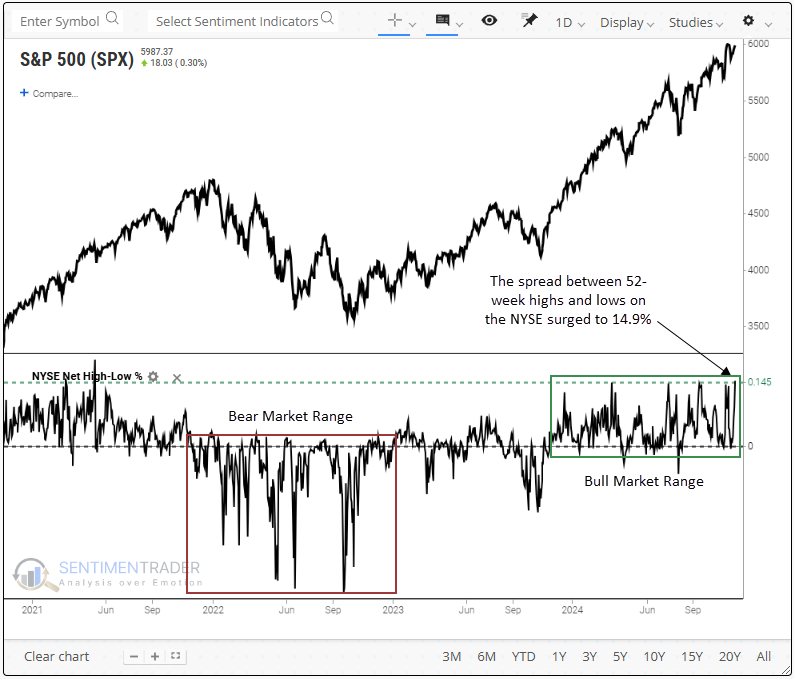
- The spread between 52-week highs and lows for NYSE issues surged to 14.9%
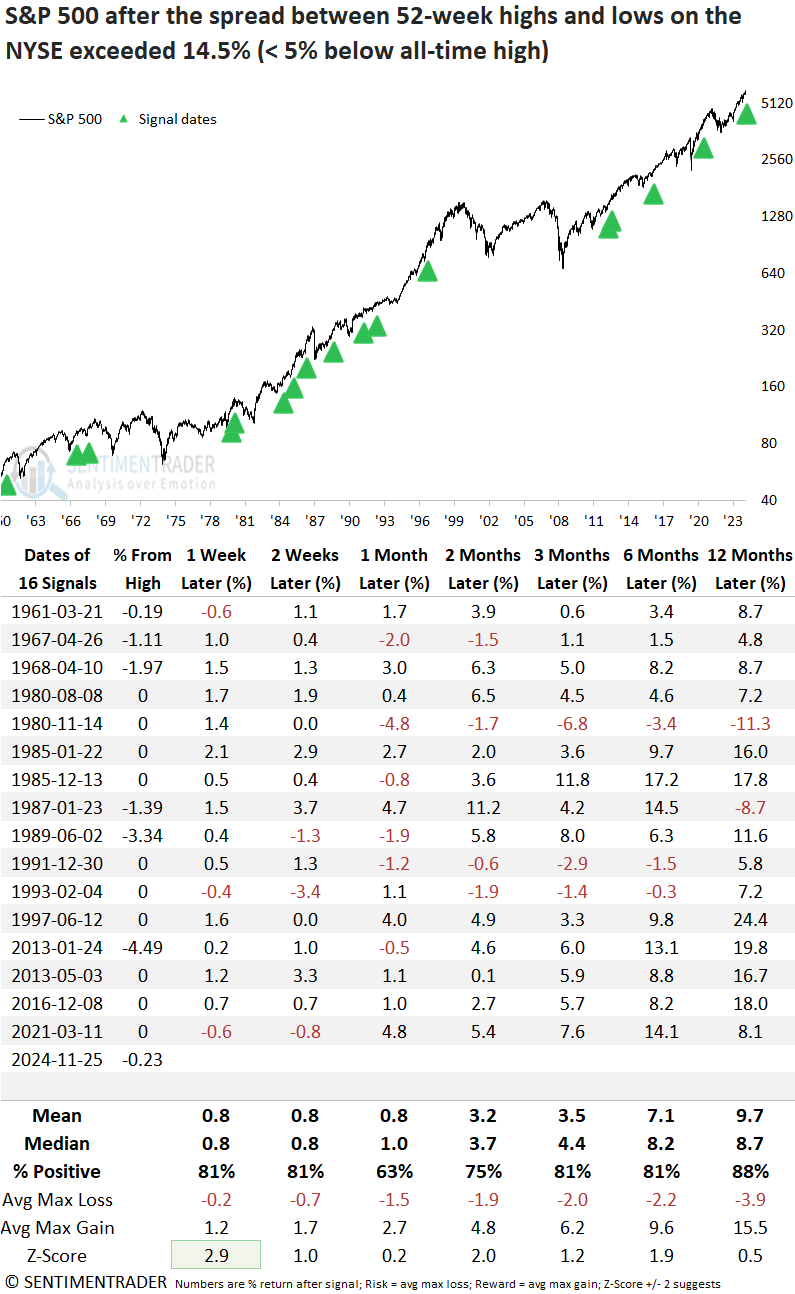
- Similar market breadth conditions produced an 88% win rate for the S&P 500 over the next year
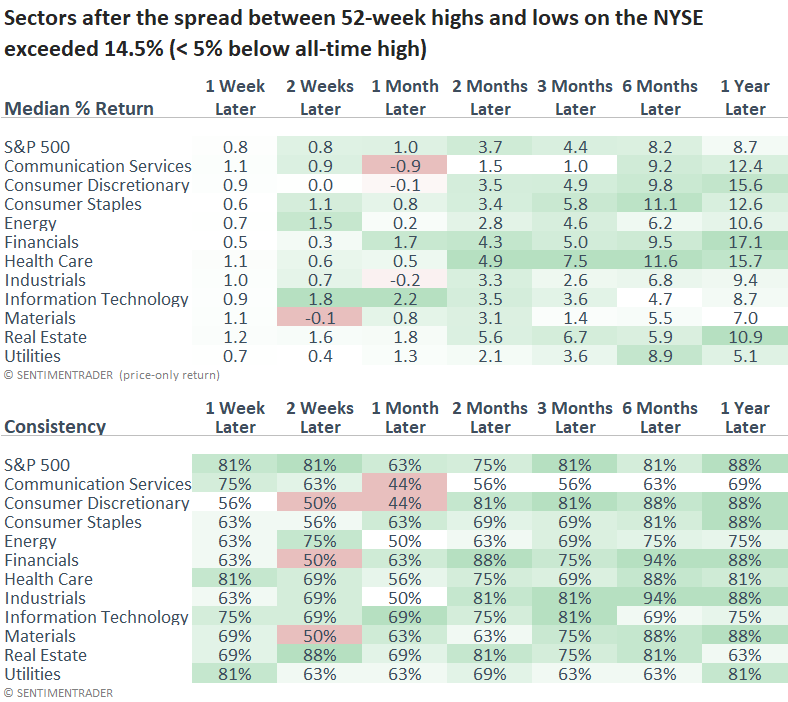
- S&P 500 Financials were the best-performing sector a year later, following comparable breadth scenarios
Stock indexes rarely peak when 52-week highs significantly outnumber 52-week lows
Treasury yields are a critical driver of the business cycle, often influencing market breadth indicators. The NYSE, which contains many bond proxies, is especially affected by this phenomenon. Monday's sharp rally (decline in yields) in the 30-year Treasury ETF (TLT) led to a notable uptick in NYSE stocks reaching 52-week highs, a scenario often associated with bullish markets.
In a report titled A Near-Record Whiplash in New Highs, Jason highlighted the dramatic downward shift in the spread between 52-week highs and lows for NYSE issues and several stock indexes. Remarkably, as quickly as these breadth-based indicators deteriorated, they swiftly recovered. Regarding the NYSE differential, it rebounded from below 0% to 14.9% in six sessions, a new high for the year and the highest level since 2021.
The previous instance when the differential between 52-week highs and lows cycled from below 0% to above 14.5% saw the S&P 500 rally 14% over six months.
I screened out repeats by requiring the spread to drop below zero and specifying at least two months must elapse before a new signal could generate an alert.
Similar spreads between 52-week highs and lows preceded positive returns
Whenever the spread between 52-week highs and lows on the NYSE surpassed 14.5%, and the S&P 500 was within 5% of its all-time high, the benchmark index demonstrated favorable returns and consistency over the subsequent year. Furthermore, aside from the November 1980 instance, none of these signals coincided with a major market top.
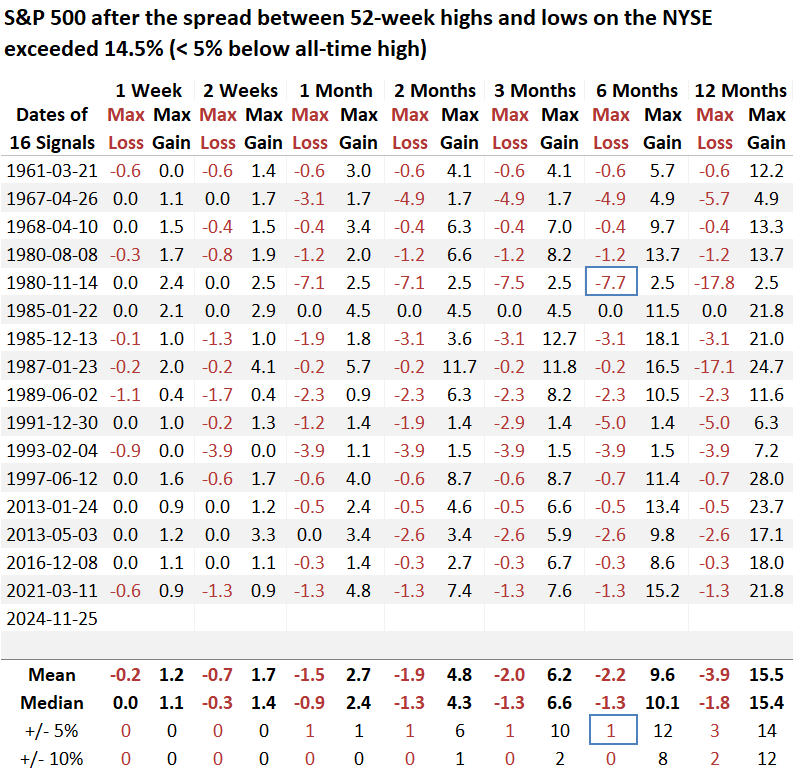
Over the subsequent six months, the S&P 500 experienced only one maximum loss exceeding 5%, which occurred in November 1980, as previously noted.
A year later, S&P 500 Financials was the best-performing sector and handily outperformed the broad market. Given the significant presence of bond proxies on the NYSE, favorable exchange breadth typically drives strong performance in the financial sector.
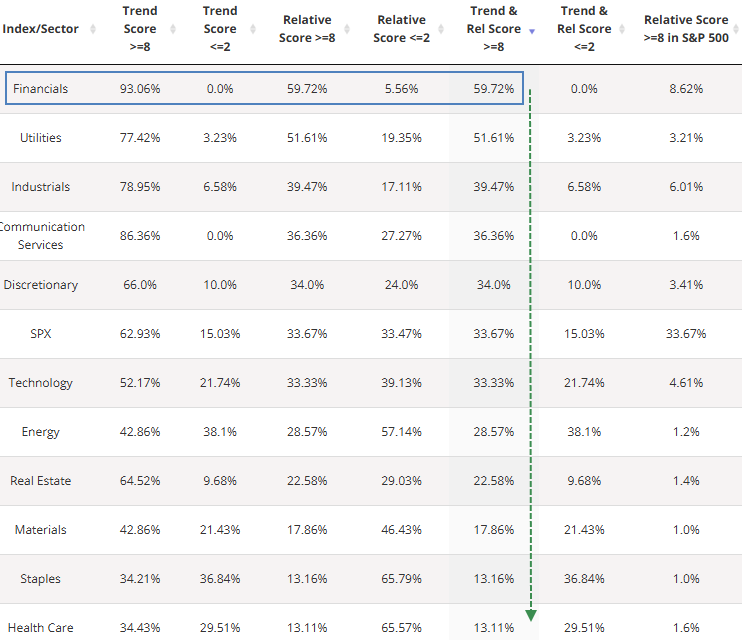
The following table, found in the Trend Score section on the website, highlights that Financials hold the largest share of stocks with an absolute and relative trend score of eight or greater. This aligns with the favorable outlook for the group following substantial increases in the NYSE 52-week high-low spread.
What the research tells us...
The recent surge in the spread between 52-week highs and lows on the NYSE to the highest level since 2021 signals a notable improvement in market breadth, a hallmark of sustainable uptrends. This scenario is particularly relevant for an exchange with considerable exposure to bond proxies and financials, as these issues typically weaken before broad market tops. Since stock indexes rarely peak when breadth broadens, the current uptrend will likely persist.