
A significant trend change in Treasury yields

Key points:
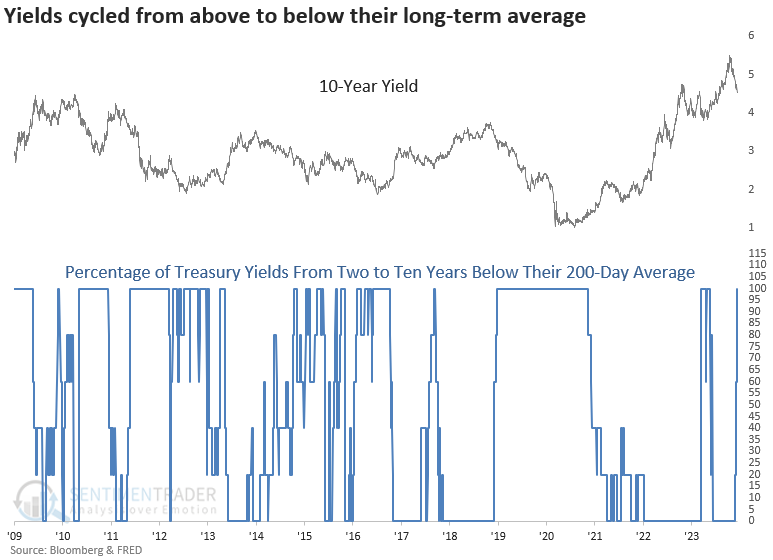
- Every single Treasury yield ranging from two to ten years is now trading below its 200-day average
- Similar shifts across the curve suggest the path of least resistance for the 10-year yield is down
- A favorable interest rate environment tended to be bullish for the S&P 500
The shift in Treasury yields indicates lower rates and higher stocks
In a previous note, I shared a study suggesting the 10-year yield could decline, and boy, it did, falling 50 bps in five weeks. At the time, every single Treasury yield from two to ten years was trading above their 200-day average.
With the FOMC holding the target rate steady for a third consecutive meeting and signaling a potential reversal in their interest rate policy, yields across the curve plunged on Wednesday, sending every Treasury yield from two to ten years below their respective 200-day averages.
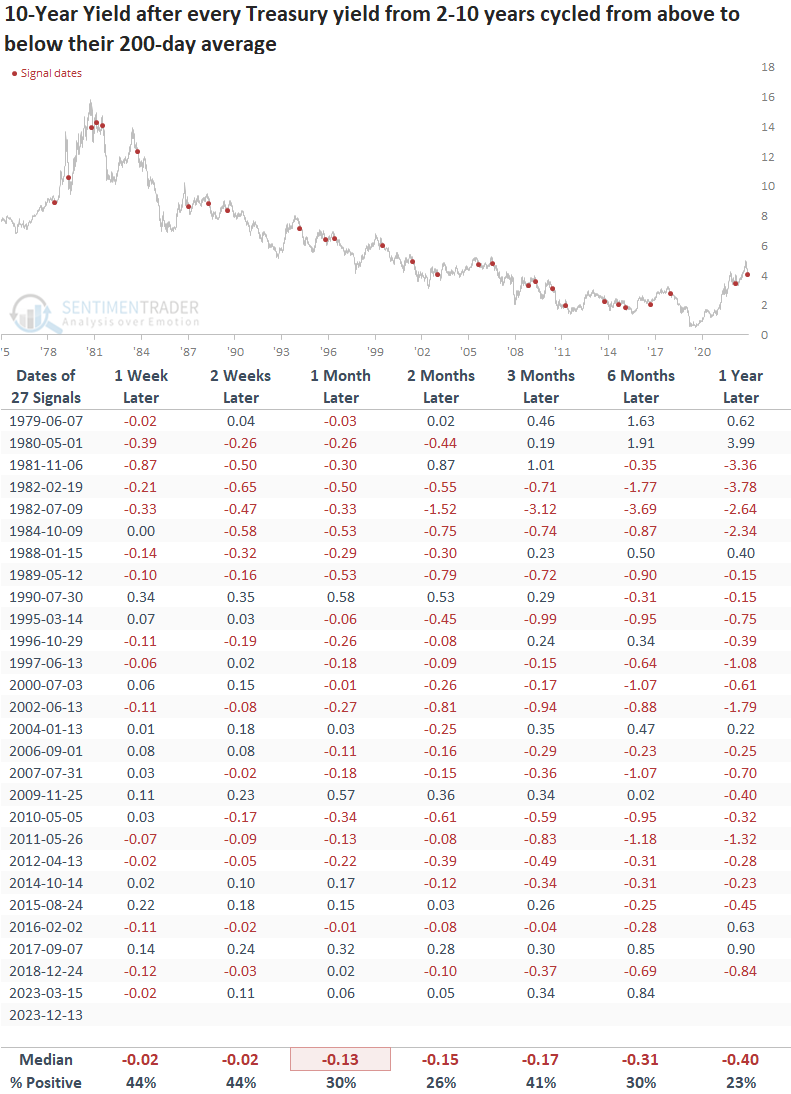
Long-term trend change shifts for Treasury yields preceded falling rates
When every single Treasury yield from two to ten years cycled from above to below its 200-day average, the 10-year yield consistently declined across all time frames.
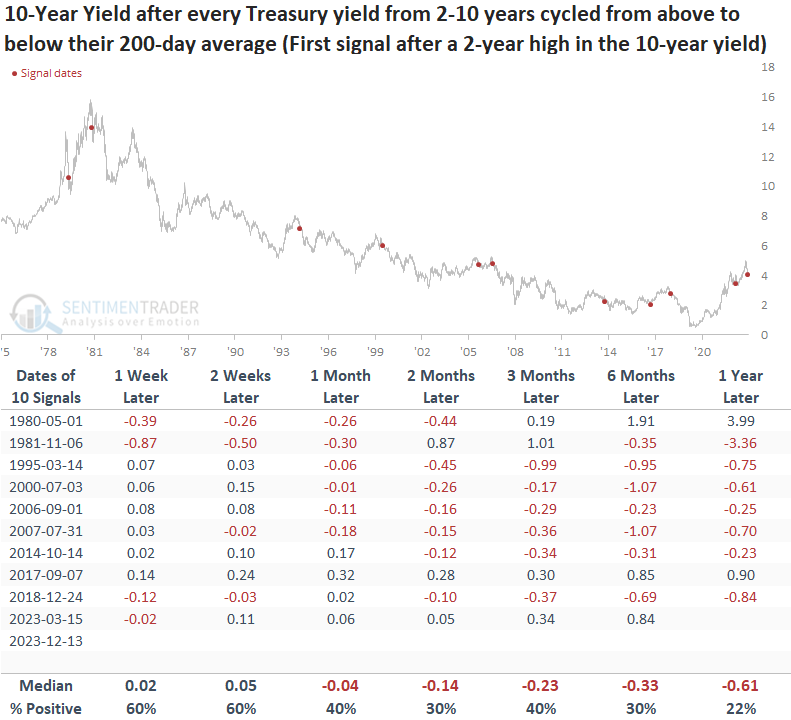
Additional context
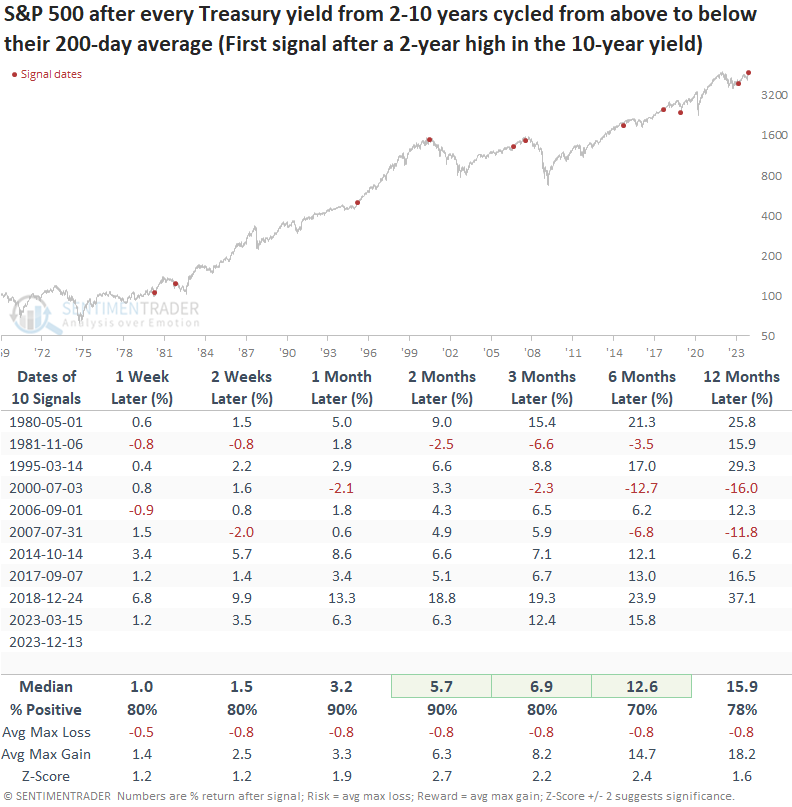
If I require the 10-year yield to close at a 2-year high before a new signal can occur again for context similar to now, the 10-year yield tended to bounce over the subsequent few weeks. After the countertrend move, the benchmark yield consistently fell from one to twelve months later.
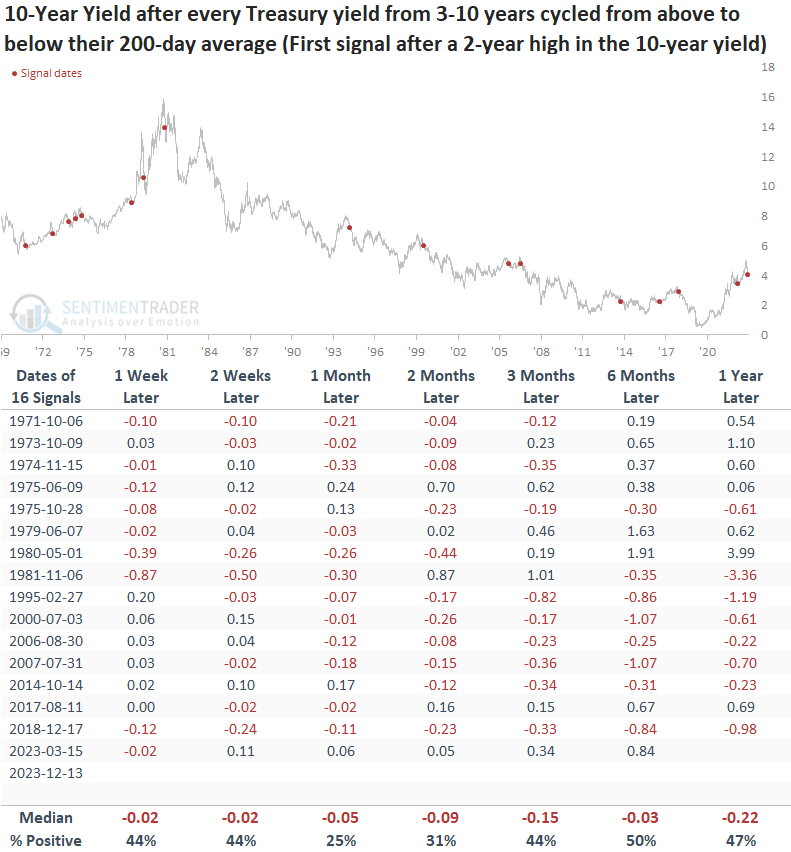
A sample size that includes a rising rate environment
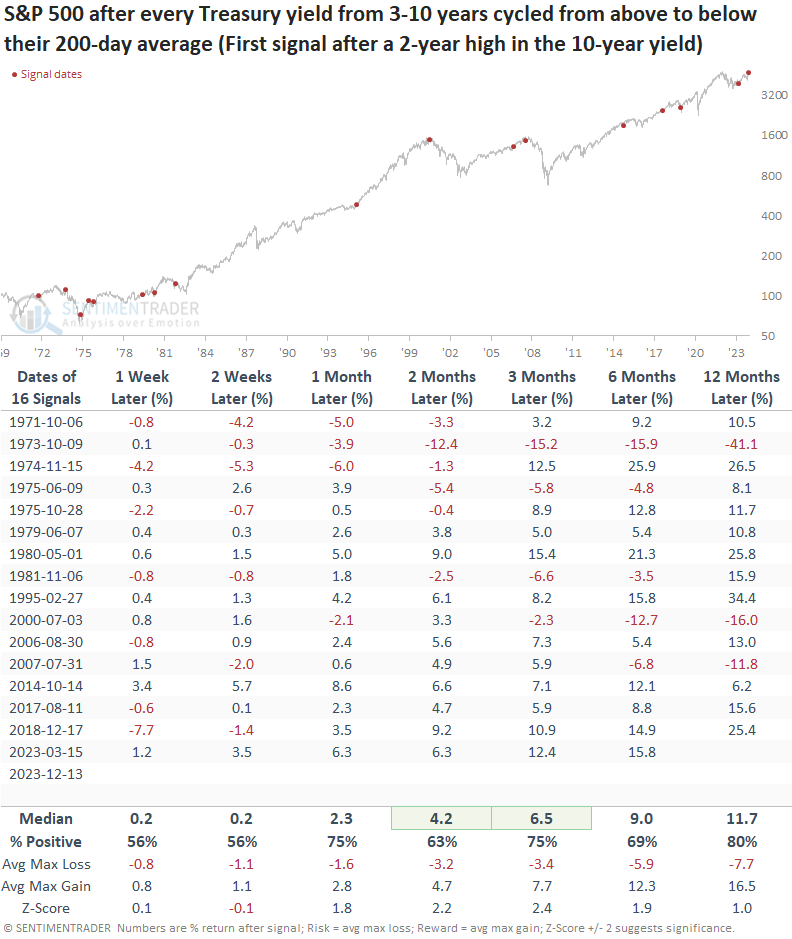
Daily 2-year yield data started in 1976. So, If I exclude it from the calculation and use yields ranging from three to ten years, we can expand the sample size to include the rising rate environment of the 1970s.
Despite including the rising rate environment, the path of least resistance for the 10-year yield remains down.
What about stocks?
The downdraft in yields proves to be a bullish factor for stocks over the following six months. While the subsequent year tends to deliver solid returns and success rates, the cautionary tales of 2000 and 2007 underscore the importance of vigilance in navigating the potential risks associated with rising rate environments.
The expanded sample size, which excludes the 2-year yield in the composite, suggests a slightly less bullish outlook due to several unfavorable signals in the 1970s.
Bonds relative to cash
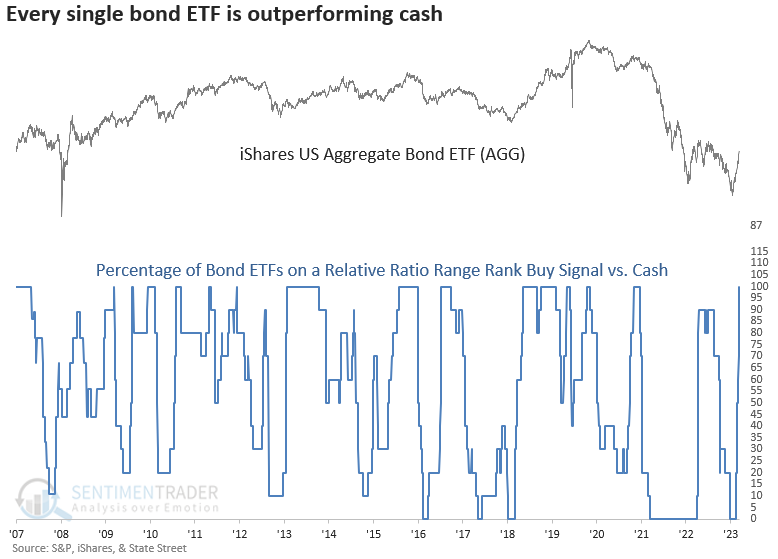
In a research report titled "Cash is King," I shared a composite that measures whether ten diverse bond ETFs are on a buy signal relative to a cash proxy.
The composite started to shift in favor of bonds over cash in mid-November and surged to 100% on Wednesday.
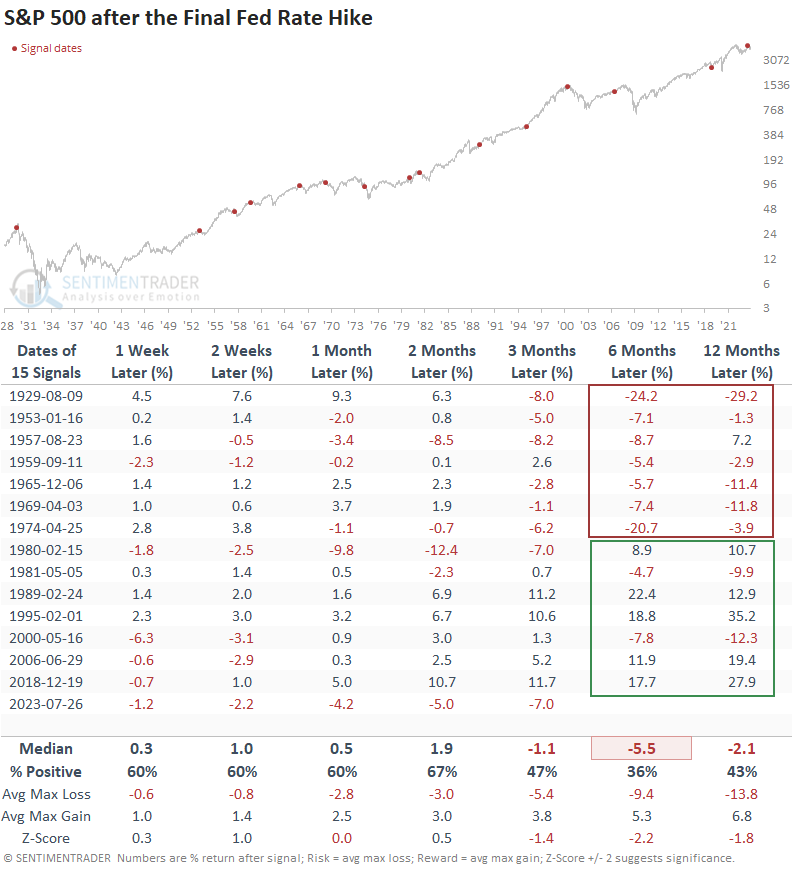
A chart perspective around rate hike cycles
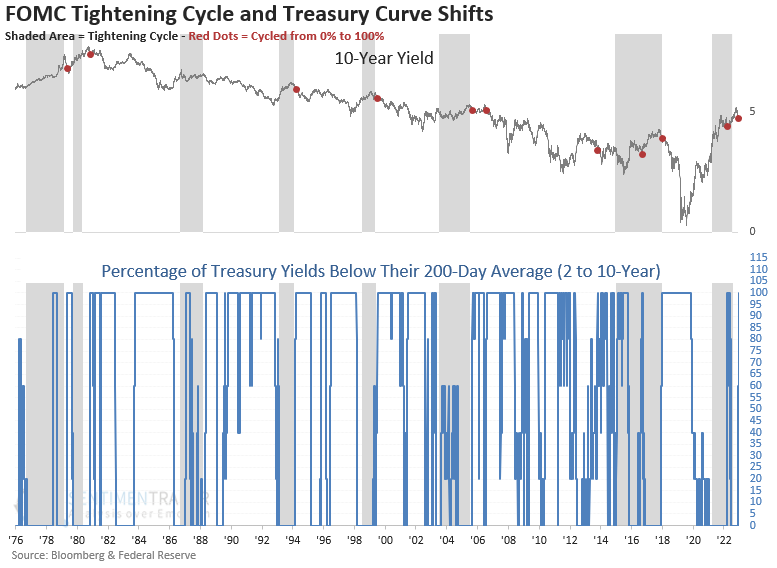
More often than not, the trend change shift tended to occur after the FOMC completed an interest rate hiking cycle.
Do interest rate hiking cycles always end in disaster?
From 1929 to 1974, the final FOMC interest rate hike produced extremely unfavorable results for the S&P 500, with seven consecutive losses over the subsequent six and twelve months. However, since 1980, the outlook over the same horizons showed gains in 5 out of 7 precedents.
What the research tells us...
A trend composite for Treasury yields ranging from two to ten years cycled from 0% to 100%, signaling that interest rates have shifted from long-term uptrends to downtrends. Similar signals suggest interest rates will fall further, resulting in a favorable stock market environment. Although it's important to note the link between the conclusion of interest rate hikes and substantial market declines, history suggests it's not an imminent threat. That was especially the case since 1980.