Products
SentimenTrader Trading Tools
‍
Backtest Engine
My Trading Toolkit
Correlation Analysis
Seasonality
Market Prediction
Indicators & Data API
‍
Proprietary Indicators & Charts
Market Data API
Strategies & Scanner
‍
50+ Trading Strategies
Smart Stock Scanner
Smart Option Scanner
Research Reports
‍
Research Solutions
Reports Library
Free Resources
Simple Backtest Calculator
Simple Seasonality Calculator
The Kelly Criterion Calculator
Sentiment Geo Map
Public Research Reports
Education
Sentiment Indicators
Technical Indicators
Pricing
Company
About
In the News
Testimonials
Client Success Stories
Contact
Log inLoginSign up
< BACK TO ALL REPORTS

A significant shift in the Technology sector

Dean Christians
2023-11-07
The Technology sector witnessed an unprecedented surge in a trend-following composite, marking one of the most significant week-over-week changes ever recorded. After similar trend score changes, the sector rallied and showed a solid tendency to outperform the S&P 500.

Key points:

  • A composite trend model for the Technology sector recorded a significant bullish surge
  • Similar trend score shifts displayed solid returns and win rates over the following three months
  • Technology tends to outperform the S&P 500 over medium and long-term horizons

Stay with the leaders until further notice

When stocks enter a correction during a bull market, it's crucial to keep a close eye on the leading sectors and industries to gauge their strength or weakness in the drawdown phase. Should these groups maintain favorable absolute and relative trend configurations, it typically suggests they will continue to lead once the correction concludes.

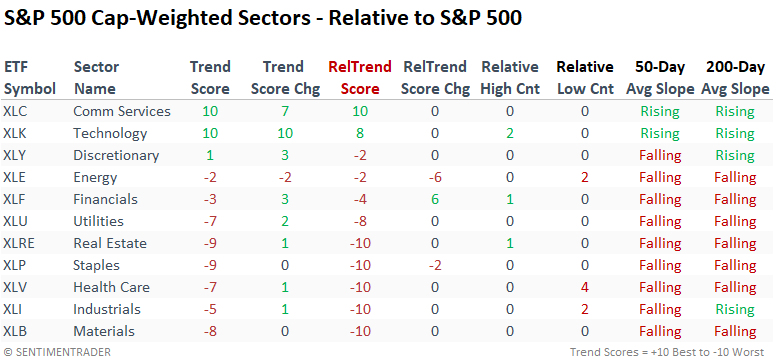
Technology was one of only two sectors to maintain a positive absolute and relative trend score during the 10% correction in the S&P 500. Communication services was the other group.

For only the 50th time since 1952, a composite trend model for the Technology sector registered a week-over-week increase of nine points or more. However, if I include a condition that requires the overall composite score to be seven or greater for context similar to now, the study identified 22 historical precedents. 

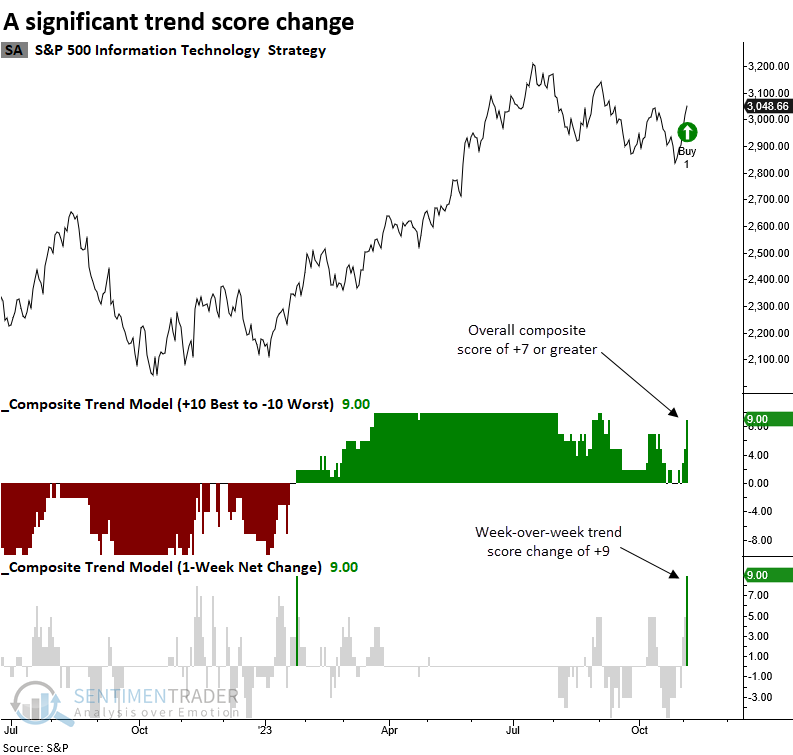
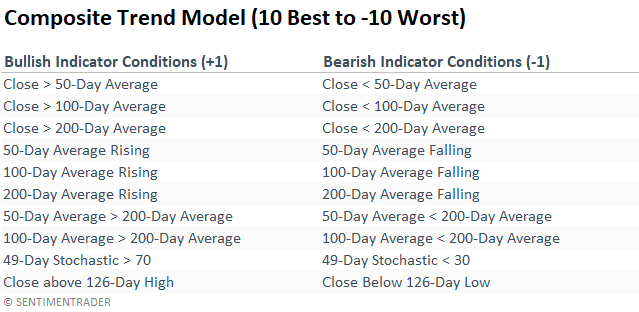
The composite trend model utilizes a scoring system of +1 for favorable trend conditions and -1 for adverse trend conditions. 

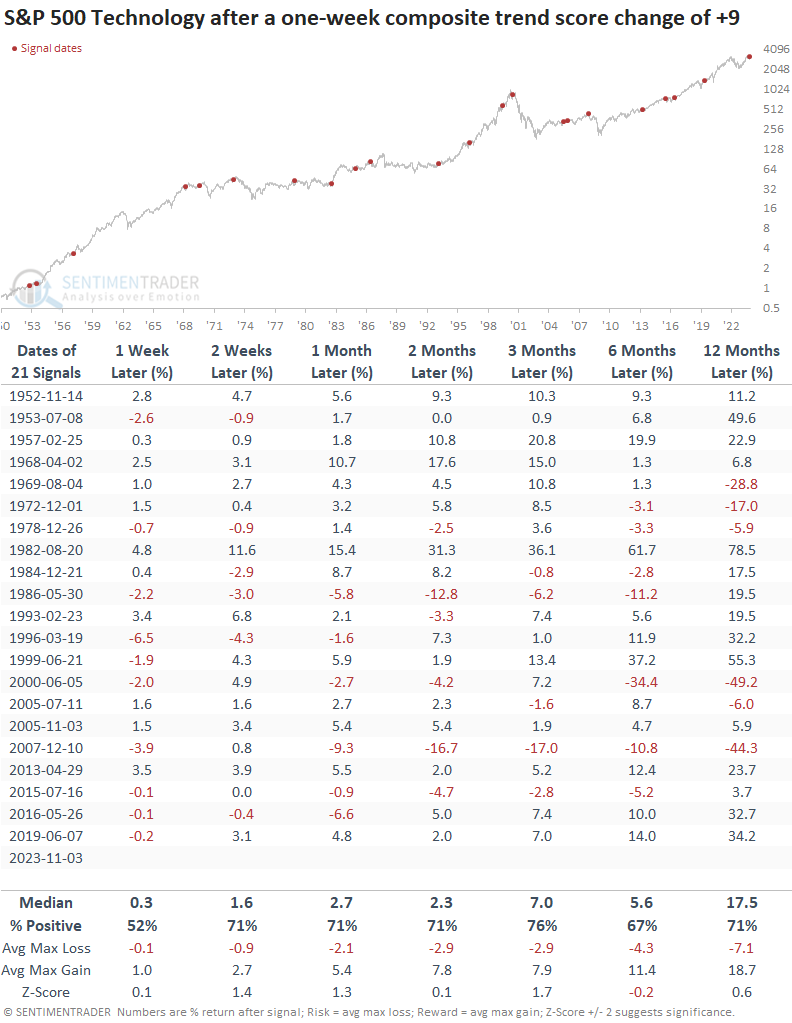
Similar trend score changes preceded positive returns

Whenever the composite trend score for the Technology sector experiences a surge of nine points or more in one week, the improvement in trend indicators usually paves the way for a bullish upward bias in the sector for the following three months. Over that same time frame, the sector was higher at some point in all but one instance, albeit two precedents were marginal gains.

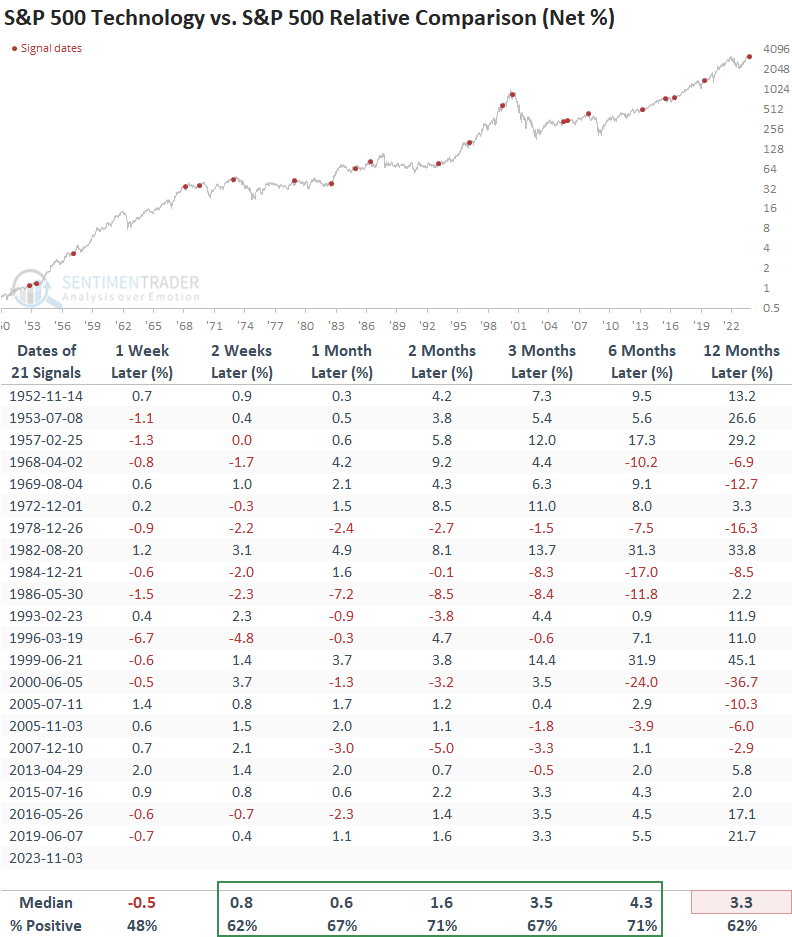
Relative performance

Excluding the first week, the Technology sector tends to outperform the broad market across medium and long-term time frames.

Absolute and relative rankings

When evaluating trend scores, Technology and Communication Services consistently lead the pack. As a result, my preference continues to favor growth-oriented sectors instead of value-based ones. 

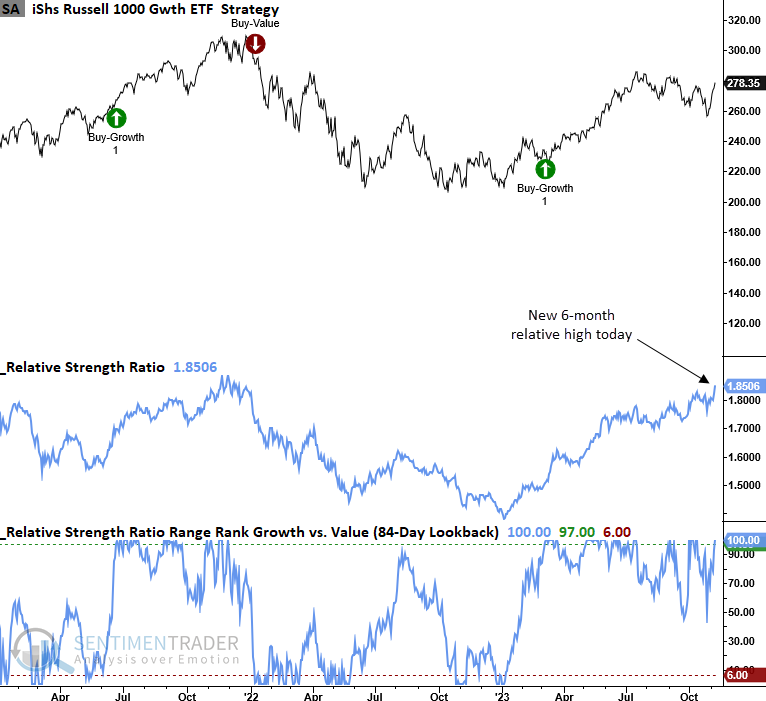
The iShares Growth ETF (IWF) continues its winning streak, outpacing the Value ETF (IWD) and achieving a new six-month high today. You can find the growth versus value timing system on our website under the Tools-Strategies tab. It's called the Growth vs. Value Relative Rato Rank System.


What the research tells us...

Technology, a year-to-date market leader, witnessed a substantial uptick in bullish trend-following indicators. As a result, a composite model surged by one of the most significant week-over-week readings in history. After similar thrusts, the sector showed a consistent upward bias over the following three months. From a comparative perspective, it outperformed the S&P 500 over medium and long-term horizons. With Technology and Communication Services maintaining a leadership status, I would favor growth over value.

PRODUCTS
SentimenTrader
Trading Tools
Indicators & Data API
‍
Strategies & Scanner
‍
Research Reports
FREE
RESOUrCES
Simple Backtest
Calculator
Simple Seasonality
Calculator
The Kelly Criterion
Calculator
Sentiment Geo Map
‍
Public Research Reports
‍
Education
Sentiment Indicators
‍
Technical Indicators
‍
Pricing
Bundle pricing
‍
FAQ
‍
Announcements
‍
COMPANY
‍
About
‍
In the News
‍
Testimonials
‍
Client Success Stories
CONTACT
‍
General Inquiries
‍
Media Inquiries
‍
Financial Professionals Inquiries
‍
© 2026 Sundial Capital Research Inc. All rights reserved.
Setsail Marketing
TermsPrivacyAffiliate Program
Risk Disclosure: The information and tools provided are for research and analytical purposes only and are not intended as investment advice. Market analysis involves uncertainty, and outcomes may differ from expectations. Users should conduct their own due diligence and consider their individual circumstances before making any financial decisions. Past performance is not necessarily indicative of future results.

Hypothetical Performance Disclosure: Hypothetical performance results have many inherent limitations, some of which are described below. No representation is being made that any account will or is likely to achieve profits or losses similar to those shown; in fact, there are frequently sharp differences between hypothetical performance results and the actual results subsequently achieved by any particular trading program. One of the limitations of hypothetical performance results is that they are generally prepared with the benefit of hindsight. In addition, hypothetical trading does not involve financial risk, and no hypothetical trading record can completely account for the impact of financial risk of actual trading. for example, the ability to withstand losses or to adhere to a particular trading program in spite of trading losses are material points which can also adversely affect actual trading results. There are numerous other factors related to the markets in general or to the implementation of any specific trading program which cannot be fully accounted for in the preparation of hypothetical performance results and all which can adversely affect trading results.

Testimonial Disclosure: Testimonials appearing on this website may not be representative of other clients or customers and is not a guarantee of future performance or success.